3 hours ago
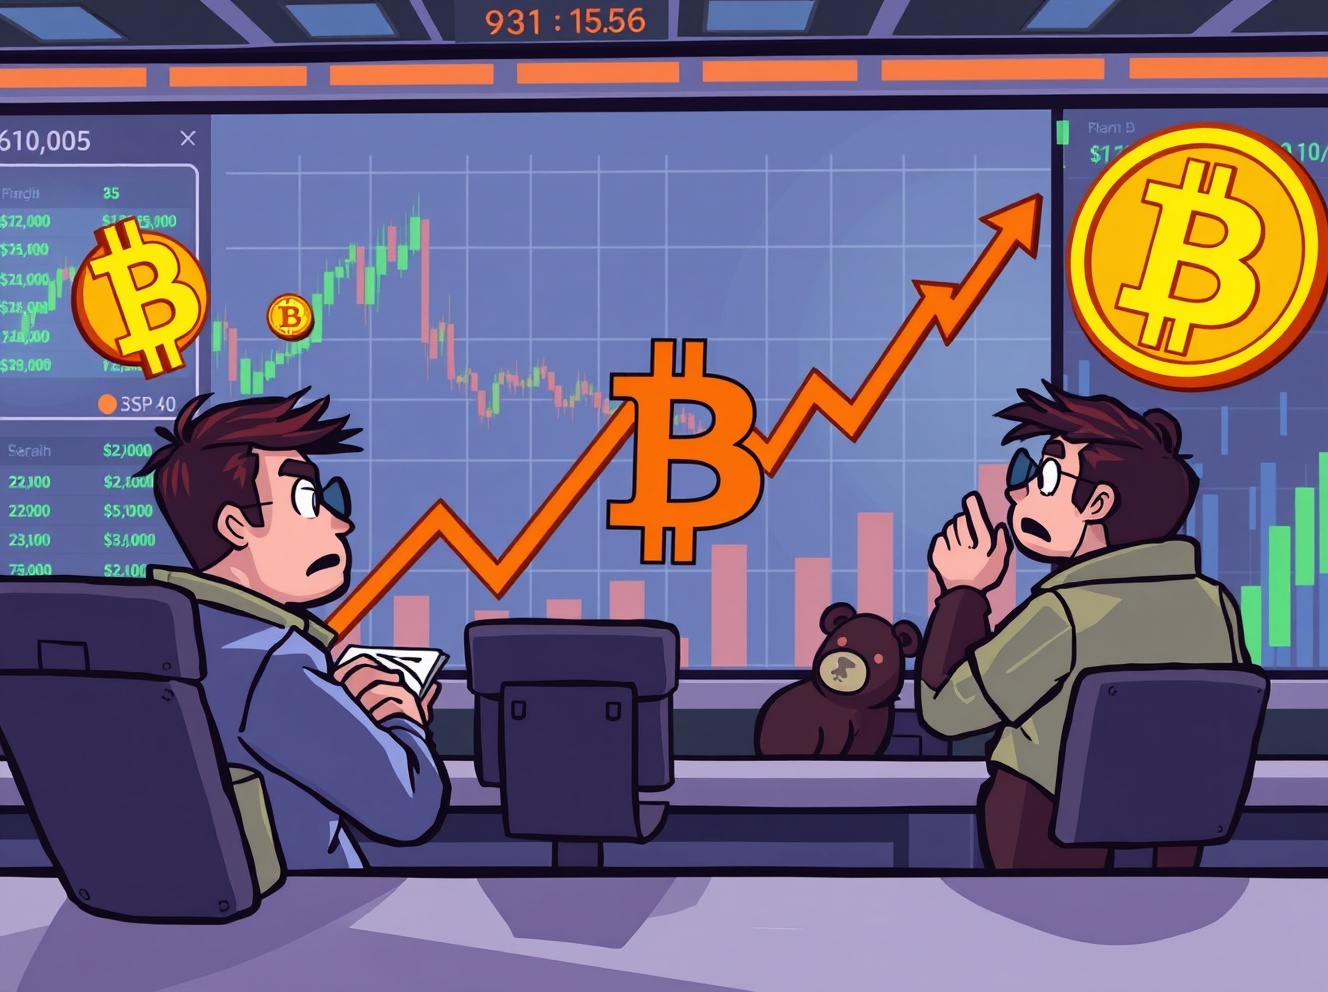
BitcoinWorld Bitcoin Options Market Reveals Shocking Surge in Bearish Bets as Traders Brace for Correction The Bitcoin options market is sending clear warning signals as traders increasingly position themselves for a potential downturn. Recent data reveals an unprecedented surge in bearish bets, indicating growing caution among market participants about Bitcoin’s near-term prospects. What’s Driving the Bitcoin Options Market Shift? Crypto options exchange Deribit reports staggering numbers that highlight this trend. The open interest for put options with an $80,000 strike price has surpassed $1 billion, while puts with a $90,000 strike have reached $1.9 billion. This massive positioning suggests traders are actively hedging against potential price declines. Interestingly, this combined bearish positioning nearly equals the total open interest for call options with strike prices between $120,000 and $140,000. However, market analysts caution against interpreting this as purely bullish sentiment on the other side. Are These Really Bullish Bets? CoinDesk’s analysis reveals a crucial nuance in the Bitcoin options market data. A significant portion of the high-strike call options likely results from a covered call strategy rather than simple bullish speculation. This sophisticated approach involves: Existing BTC holders selling call options Generating premium income from their holdings Managing risk while maintaining exposure This strategy indicates that even long-term holders are becoming more cautious in the current Bitcoin options market environment. Why the Sudden Caution in Bitcoin Options Trading? Several factors are contributing to the shifting sentiment in the Bitcoin options market. Traders appear to be bracing for potential volatility amid: Regulatory uncertainty in major markets Macroeconomic pressures affecting risk assets Technical indicators suggesting overbought conditions Institutional profit-taking after recent gains The concentration of put options at specific strike prices suggests traders are establishing clear risk management levels in the Bitcoin options market. What Does This Mean for Bitcoin Investors? The current activity in the Bitcoin options market provides valuable insights for all market participants. The surge in bearish positioning indicates: Increased hedging activity among institutional players Growing risk awareness following recent price appreciation Sophisticated strategy implementation by experienced traders Potential support and resistance levels for future price action This development in the Bitcoin options market doesn’t necessarily predict a major crash, but it does signal that professional traders are preparing for increased volatility. Key Takeaways from the Bitcoin Options Market Data The current state of the Bitcoin options market reveals several important trends that every crypto investor should understand. The massive put option interest demonstrates how derivatives markets can provide early warning signals about shifting sentiment. Moreover, the prevalence of covered call strategies shows that even bullish investors are adopting more conservative approaches in the current Bitcoin options market environment. This balanced perspective helps create more stable market conditions despite the apparent bearish positioning. Frequently Asked Questions What are put options in the Bitcoin options market? Put options give holders the right to sell Bitcoin at a specific price by a certain date. They’re bearish bets that profit when prices fall below the strike price. Why are traders buying so many put options? Traders are likely hedging against potential price declines or speculating on a market correction after recent price gains. Does high put volume always mean prices will drop? Not necessarily. High put volume can indicate hedging rather than pure bearish speculation, and markets often surprise consensus expectations. What is a covered call strategy? A covered call involves selling call options against Bitcoin you already own to generate additional income while maintaining your position. How reliable are options market signals for price prediction? Options market data provides valuable sentiment indicators but should be combined with other analysis methods for comprehensive market understanding. Should retail investors worry about this options activity? While worth monitoring, retail investors should focus on their own risk tolerance and investment strategy rather than overreacting to derivatives market movements. Found this analysis of the Bitcoin options market helpful? Share these insights with fellow crypto enthusiasts on social media to help them understand the latest market dynamics and make informed trading decisions. To learn more about the latest Bitcoin trends, explore our article on key developments shaping Bitcoin price action and institutional adoption. This post Bitcoin Options Market Reveals Shocking Surge in Bearish Bets as Traders Brace for Correction first appeared on BitcoinWorld .
Bitcoin World
You can visit the page to read the article.
Source: Bitcoin World
Tags :
Crypto News BITCOIN Crypto Derivatives Market Analysis options trading risk-management
Disclaimer: The opinion expressed here is not investment advice – it is provided for informational purposes only. It does not necessarily reflect the opinion of BitMaden. Every investment and all trading involves risk, so you should always perform your own research prior to making decisions. We do not recommend investing money you cannot afford to lose.
XRP Price Sees Bullish Move, Can Buyers Protect Upside Levels?
XRP price started a recovery wave from $2.050. The price is now back above $2.25 and might attempt to surpass the $2.420 resistance zone. XRP price was able to start a recovery wave above $2.20. The price is now trading above $2.250 and the 100-hourly Simple Moving Average. There was a break above a bearish trend line with resistance at $2.240 on the hourly chart of the XRP/USD pair (data source from Kraken). The pair could continue to move up if it clears $2.420. XRP Price Starts Recovery XRP price extended losses below $2.25 and $2.20, like Bitcoin and Ethereum . The price dipped below the $2.150 and $2.120 levels. A low was formed at $2.066, and the price recently started a recovery wave. There was a move above the $2.20 and $2.25 levels. The price climbed above the 50% Fib retracement level of the downward move from the $2.552 swing high to the $2.066 low. Besides, there was a break above a bearish trend line with resistance at $2.240 on the hourly chart of the XRP/USD pair. The price is now trading above $2.250 and the 100-hourly Simple Moving Average. If there is a fresh upward move, the price might face resistance near the $2.40 level. The first major resistance is near the $2.420 level and the 76.4% Fib retracement level of the downward move from the $2.552 swing high to the $2.066 low, above which the price could rise and test $2.480. A clear move above the $2.480 resistance might send the price toward the $2.550 resistance. Any more gains might send the price toward the $2.650 resistance. The next major hurdle for the bulls might be near $2.720. Another Decline? If XRP fails to clear the $2.420 resistance zone, it could start a fresh decline. Initial support on the downside is near the $2.280 level. The next major support is near the $2.250 level. If there is a downside break and a close below the $2.250 level, the price might continue to decline toward $2.20. The next major support sits near the $2.120 zone, below which the price could continue lower toward $2.060. Technical Indicators Hourly MACD – The MACD for XRP/USD is now losing pace in the bearish zone. Hourly RSI (Relative Strength Index) – The RSI for XRP/USD is now above the 50 level. Major Support Levels – $2.280 and $2.250. Major Resistance Levels – $2.40 and $2.420. Bitcoin World

Bitcoin Consolidates Above $100K, Potential $165K Target in Sight
Bitcoin maintains stability above $100,000 amid consolidation patterns, bolstered by robust support levels and increasing exchange reserves, positioning it for a potential rally toward $165,000 or higher in the ongoing Bitcoin World