3 hours ago
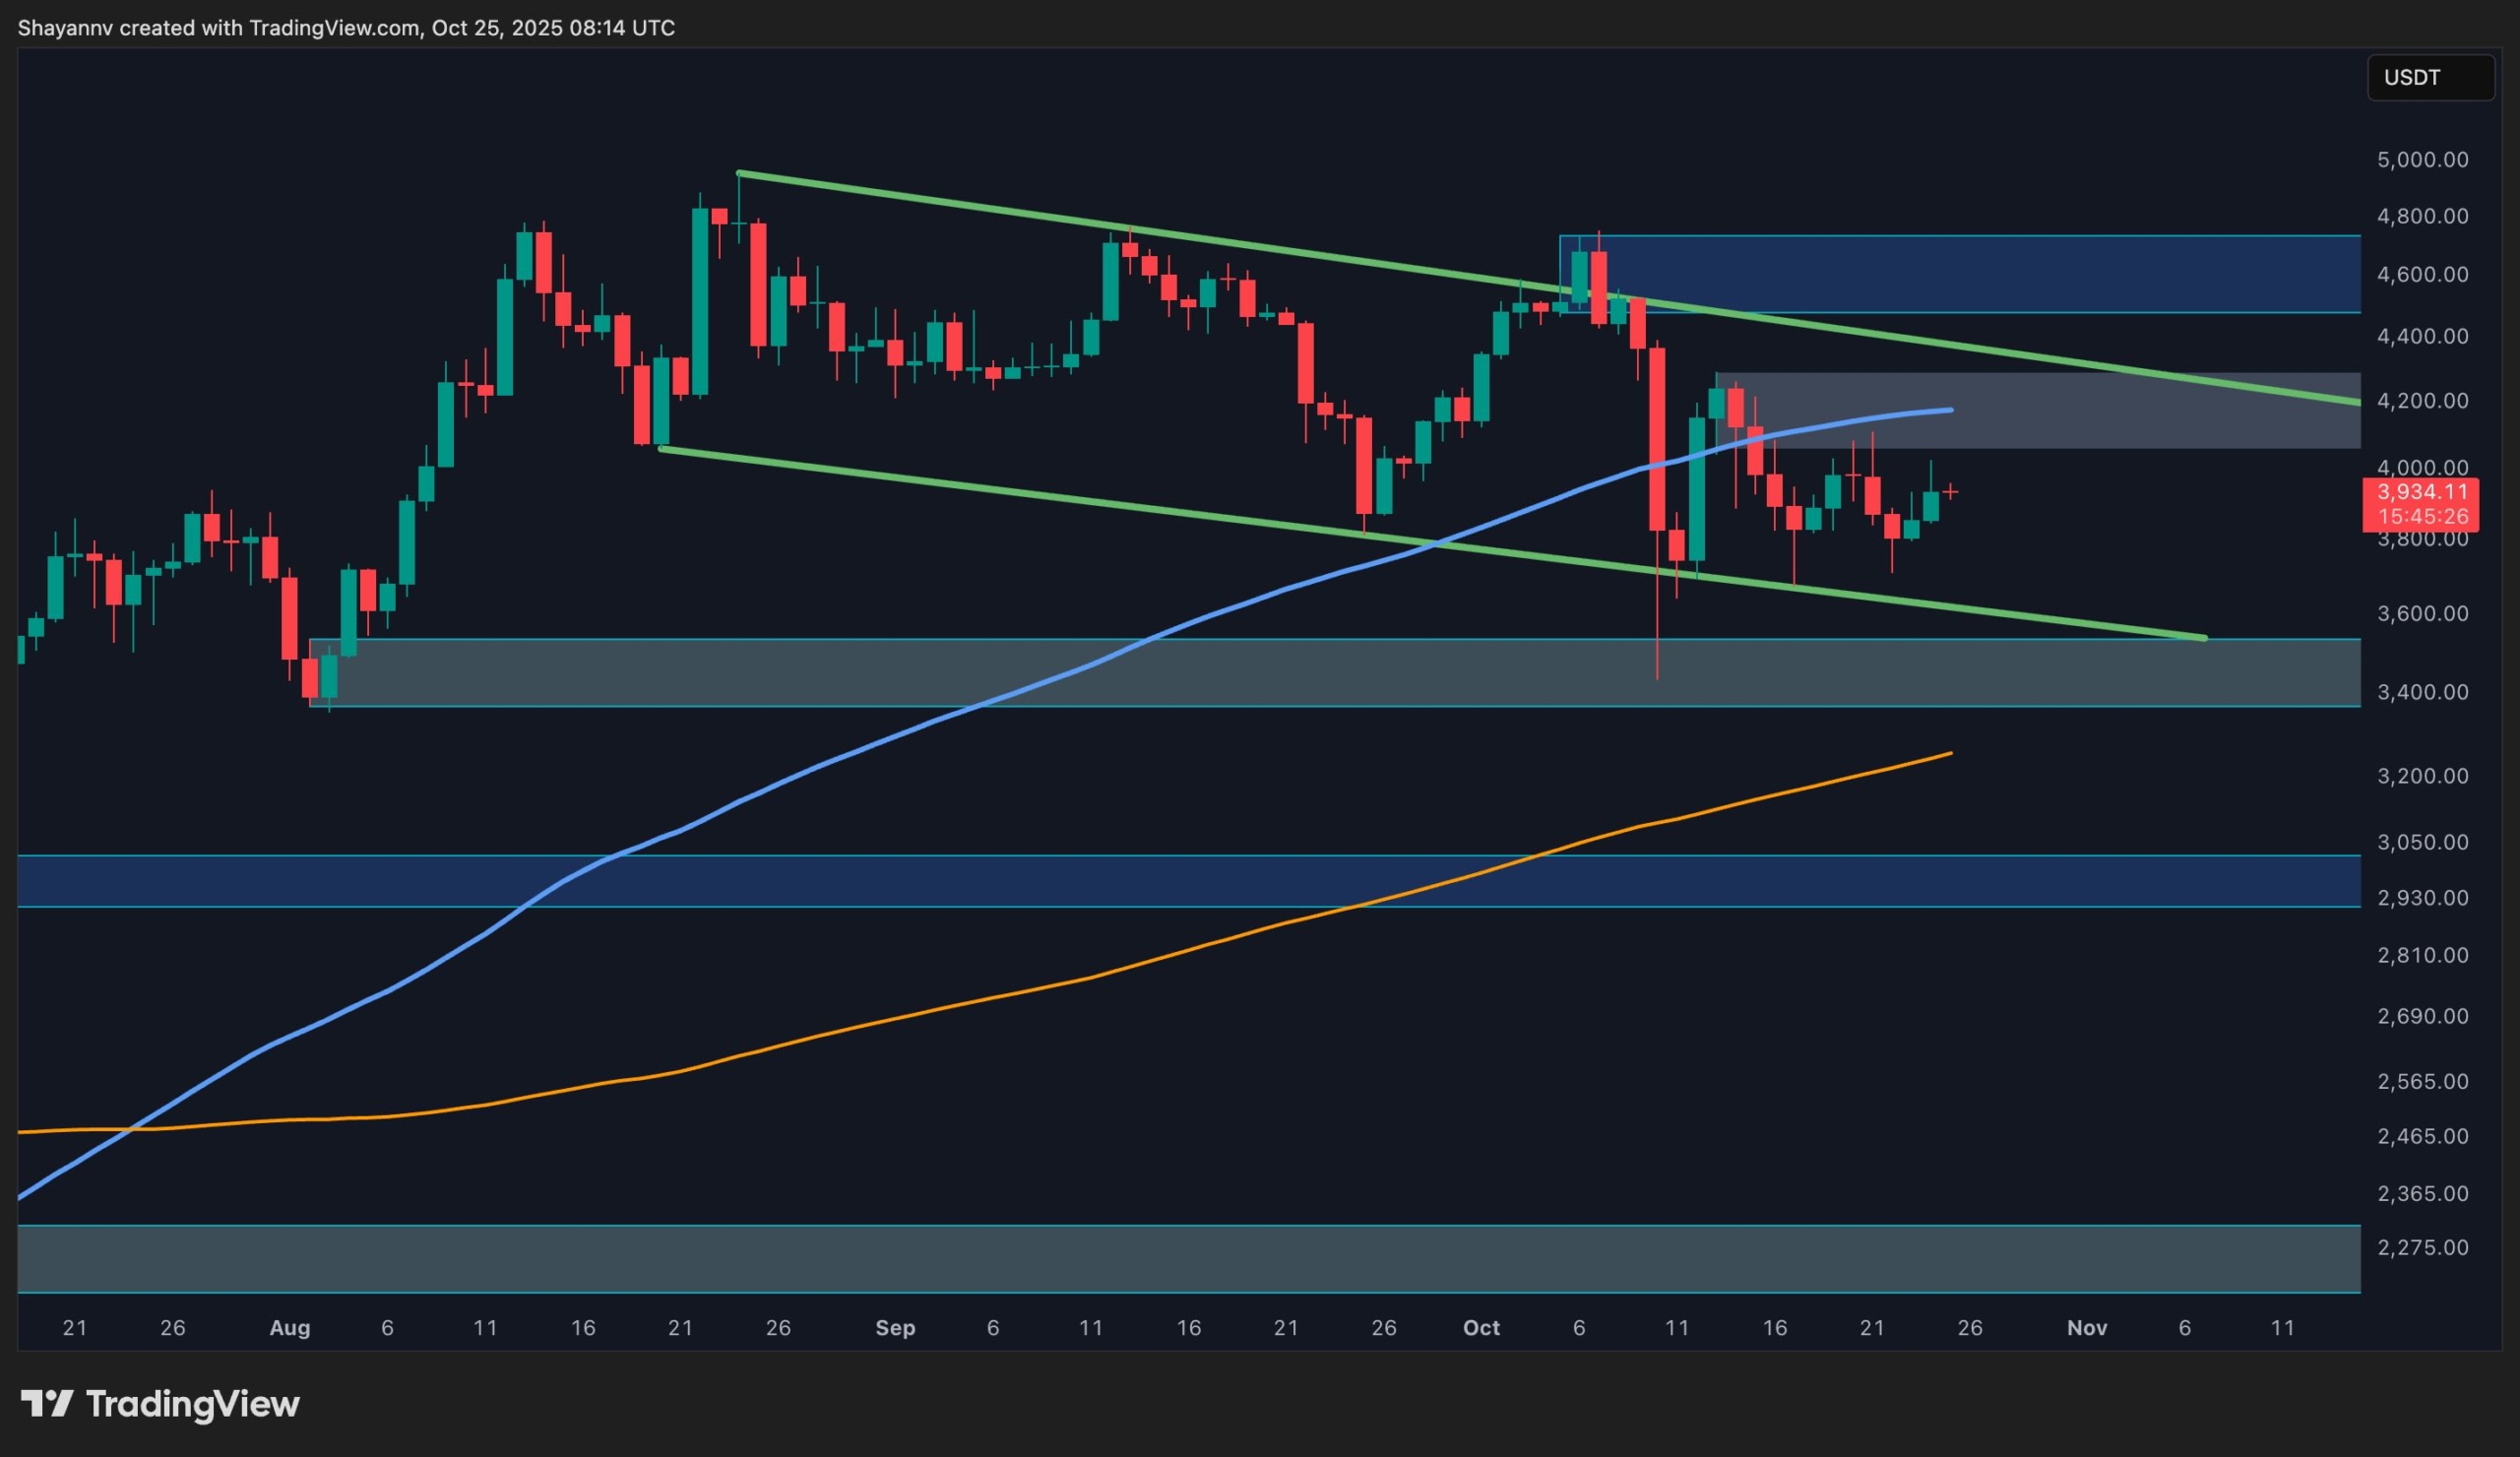
Ethereum continues to display choppy price action, remaining confined within a critical range as both buyers and sellers await a decisive breakout. Further consolidation is likely before a clear directional move takes shape. Technical Analysis By Shayan The Daily Chart On the daily timeframe, Ethereum’s consolidation phase has extended, with volatility and momentum both fading. Price action remains trapped within a crucial range defined by the 100-day moving average and the flag pattern’s upper boundary near $4.1K. This region represents a key supply zone that has repeatedly rejected upward attempts. On the downside, the flag’s lower boundary, aligning with the $3.5K demand zone, acts as the primary support where buyers have consistently defended. Until a breakout occurs, Ethereum is expected to continue consolidating within this structure, absorbing order flow and building liquidity. A confirmed bullish breakout above $4.1K could likely trigger an impulsive rally toward a new all-time high (ATH). The 4-Hour Chart The 4-hour timeframe reveals Ethereum fluctuating inside a symmetrical triangle, reflecting ongoing market indecision and equilibrium between buyers and sellers. The asset is currently trading just below the triangle’s upper boundary near $4K, with momentum still insufficient for a confirmed breakout. This compression pattern signals a liquidity buildup phase, where traders are positioning ahead of a potential volatility expansion. If bulls manage to push above the upper trendline, a rally toward $4.1K and potentially $4.6K could follow. Conversely, a breakdown below $3.7K would expose the $3.4K demand zone once again. Until confirmation, Ethereum is likely to continue oscillating within this narrowing range — a setup that typically precedes a sharp directional breakout. Sentiment Analysis By Shayan The 1-month liquidation heatmap for Ethereum reveals a dense liquidity pocket forming above the $4.8K swing high, situated directly beyond the current symmetrical consolidation structure. This area corresponds to a significant cluster of resting short liquidations, implying that if Ethereum reclaims the mid-range near $4.1K–$4.3K, a rapid move to absorb this overhead liquidity could follow. Below the current price, the $3.5K range displays relatively weaker liquidation density, indicating that much of the downside liquidity was already cleared during last week’s sell-off, though a smaller residual cluster remains. This configuration reinforces the idea that Ethereum is likely to continue oscillating within its present consolidation range until one of these liquidity pockets is decisively tested. Overall, the heatmap confirms that short-term volatility will remain concentrated within the $3.4K–$4.8K corridor, with the upper range carrying a slightly higher probability of being targeted first due to the larger liquidity concentration above current levels. The post Ethereum Price Analysis: These Are ETH’s Next Targets Despite Prolonged Consolidation appeared first on CryptoPotato .
Crypto Potato
You can visit the page to read the article.
Source: Crypto Potato
Tags :
Crypto News ETH Analysis ETHBTC ETHUSD Ethereum (ETH) Price
Disclaimer: The opinion expressed here is not investment advice – it is provided for informational purposes only. It does not necessarily reflect the opinion of BitMaden. Every investment and all trading involves risk, so you should always perform your own research prior to making decisions. We do not recommend investing money you cannot afford to lose.
Analyst: XRP Is Gearing Up for Liftoff to $7. Here’s why

A recent analysis by XRP_Cro (@stedas) has renewed interest in XRP’s long-term price outlook. The analyst shared a chart highlighting what appears to be a decisive breakout from a long-term consolidation pattern. The chart illustrates a clear bullish setup formed over several years of compression, with the potential to send XRP to double-digit prices. The weekly timeframe shows the digital asset breaking through a descending resistance trendline that has constrained price action since its previous major cycle high. The structure resembles a descending triangle , bounded by converging support and resistance lines marked in yellow. #XRP is gearing up for liftoff. Targets on the radar: $7, $12… maybe even $25 pic.twitter.com/EPrmNrn4KD — XRP_Cro AI / Gaming / DePIN (@stedas) October 24, 2025 Technical Patterns and Fibonacci Projections The chart presents a sequence of Fibonacci retracement and extension levels plotted against the major swing high and low. The key Fibonacci levels are 1.272, 1.414, and 1.618, positioned around $8.31, $13.45, and $26.80, respectively. These align closely with the specific targets labeled on the chart at $7.92, $13.10, and $24.93. The clustering of these targets within the higher Fibonacci extension zones reinforces the interpretation of a potential continuation pattern. XRP_Cro’s chart also highlights how the price consolidated above former resistance before moving upward, a sign often regarded as a confirmation of renewed momentum. The most recent candles also show compression within other descending triangles. The digital asset began a new descending triangle at the start of 2025, and broke above it in July when it rose to a new all-time high . The digital asset is now trading within another descending triangle, and a breakout could send it toward the first target of $7.92. We are on X, follow us to connect with us :- @TimesTabloid1 — TimesTabloid (@TimesTabloid1) June 15, 2025 What’s Next for XRP? While the chart-based projections indicate ambitious upside levels, they remain grounded in standard technical tools. Fibonacci extensions, when applied to breakout structures, often serve as reference points for price discovery once prior resistance zones have been cleared. In this case, the alignment between multiple Fibonacci levels and XRP_Cro’s manually labeled targets strengthens the technical argument behind the analysis. The analyst did not provide a timeline for these targets but emphasized that XRP appears “gearing up for liftoff,” implying confidence in the formation’s bullish potential . As with all technical projections, future performance will depend on sustained momentum and broader market conditions. However, the structure presented in the analysis demonstrates that XRP’s price chart has entered a technically significant phase, one that traders will likely monitor closely as it unfolds. Disclaimer : This content is meant to inform and should not be considered financial advice. The views expressed in this article may include the author’s personal opinions and do not represent Times Tabloid’s opinion. Readers are advised to conduct thorough research before making any investment decisions. Any action taken by the reader is strictly at their own risk. Times Tabloid is not responsible for any financial losses. Follow us on X , Facebook , Telegram , and Google News The post Analyst: XRP Is Gearing Up for Liftoff to $7. Here’s why appeared first on Times Tabloid . Crypto Potato

Shiba Inu Team Reaches Out to SHIB Community as Prices Stagnate
The Shiba Inu team has penned a message for the SHIB community as the broader crypto market enters a state of calm after October`s historic sell-off. Crypto Potato