3 hours ago
The Clarity Act represents the most significant cryptocurrency legislation in U.S. history, establishing clear regulatory frameworks for digital assets to end years of uncertainty. Senator Cynthia Lummis, a Wyoming Republican,
CoinOtag
You can visit the page to read the article.
Source: CoinOtag
Tags :
Guides News BTC
Disclaimer: The opinion expressed here is not investment advice – it is provided for informational purposes only. It does not necessarily reflect the opinion of BitMaden. Every investment and all trading involves risk, so you should always perform your own research prior to making decisions. We do not recommend investing money you cannot afford to lose.
Analyst to XRP Investors: Ignore the Noise, What’s Coming Will Melt Faces
ChartNerd (@ChartNerdTA), a well-known crypto analyst, recently urged the XRP community to “ignore the noise” while sharing an in-depth analysis from EGRAG CRYPTO (@egragcrypto). The chart he shared outlines XRP’s long-term structure and ongoing accumulation phase, suggesting that the asset could be preparing for a significant upward movement. EGRAG CRYPTO described the current setup as a technical formation built over years of data. The chart, labeled “ The Bifrost Bridge ,” depicts XRP trading within a defined ascending channel, with clear resistance and support zones. According to the analyst, XRP has been consolidating in a 12-month accumulation range, which historically precedes a major price expansion. The analysis emphasizes that this accumulation is forming above every major candle body since inception, which he says represents a “solid, rigid support zone.” $XRP : Ignore The Noise https://t.co/WI1geeSPY4 pic.twitter.com/beCg7wL7KZ — ChartNerd (@ChartNerdTA) November 3, 2025 A Conviction Built on Structure EGRAG CRYPTO highlighted that the technical setup reflects the same structural behavior of early XRP cycles. However, he explained that the current market environment is more mature and complex, making the pattern unfold slowly. He also noted that traders who continue to short XRP are “fighting the structure itself,” pointing to the repeated validation of the support zones within the blue range shown on the chart. The analysis implies that XRP’s long-term technical structure remains intact despite recent fluctuations , suggesting a potential continuation of the upward trend once consolidation ends. The Critical Blue Box Zone One of the central points in EGRAG CRYPTO’s post was the blue box area highlighted on the chart, which he identified as the key support range for XRP. When addressing the possibility of the price breaking below that zone, he said, “If that ever happens, the entire global financial system will be in deeper trouble than XRP itself.” We are on X, follow us to connect with us :- @TimesTabloid1 — TimesTabloid (@TimesTabloid1) June 15, 2025 The analyst argued that prolonged consolidation often misleads bearish traders, who mistake time-based stagnation for directional weakness. By contrast, his interpretation views this extended phase as necessary for structural maturity before XRP resumes its next leg upward . Generational Wealth Perspective EGRAG CRYPTO closed his post by reaffirming that his analysis is focused on long-term positioning rather than short-term trading. He wrote, “I’m here for generational wealth,” adding that people will see prices like $19.5 and $17 as entry points. XRP traded at $2.39 at the time of his post, but the analysis suggests that the asset is nearing the end of its consolidation within the accumulation range. The outlined channel indicates potential room for expansion toward higher price levels if market momentum confirms the structure. Disclaimer : This content is meant to inform and should not be considered financial advice. The views expressed in this article may include the author’s personal opinions and do not represent Times Tabloid’s opinion. Readers are advised to conduct thorough research before making any investment decisions. Any action taken by the reader is strictly at their own risk. Times Tabloid is not responsible for any financial losses. Follow us on X , Facebook , Telegram , and Google News The post Analyst to XRP Investors: Ignore the Noise, What’s Coming Will Melt Faces appeared first on Times Tabloid . CoinOtag
Solana (SOL) Nosedives to $150, Can Bulls Prevent Further Collapse?
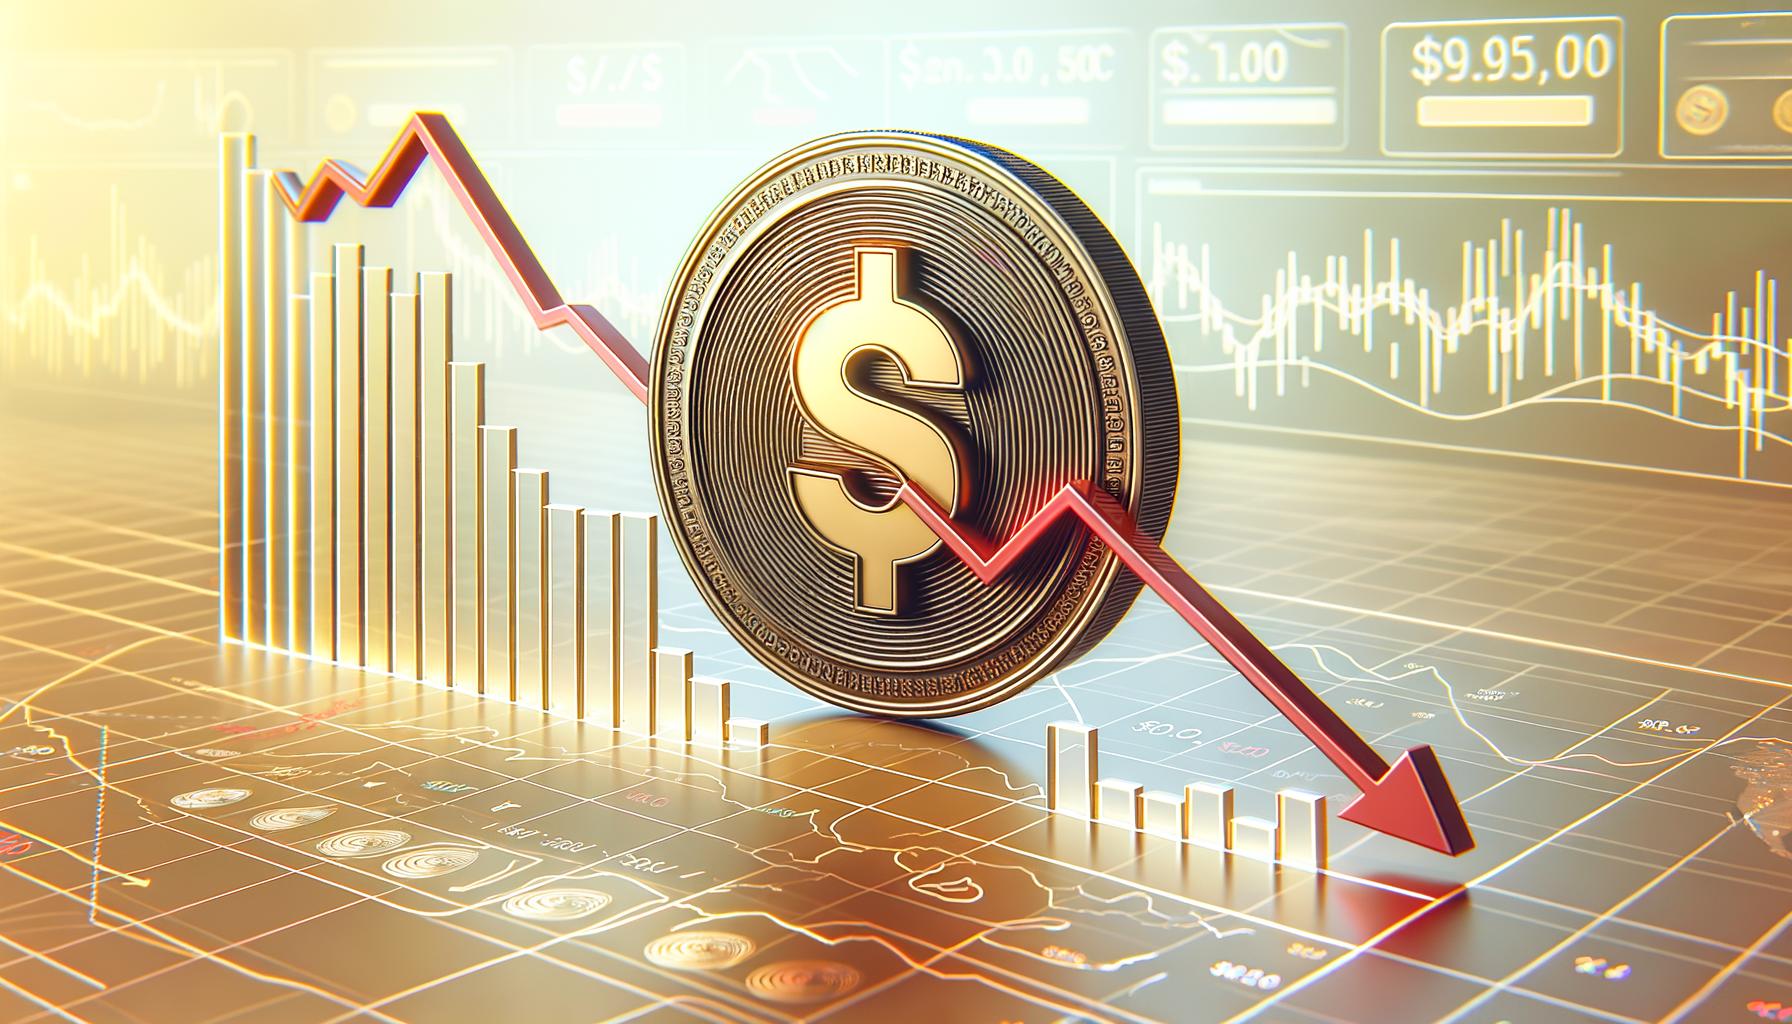
Solana started a fresh decline below the $165 zone. SOL price is now consolidating losses below $165 and might decline further below $150. SOL price started a fresh decline below $165 and $162 against the US Dollar. The price is now trading below $165 and the 100-hourly simple moving average. There is a key bearish trend line forming with resistance at $158 on the hourly chart of the SOL/USD pair (data source from Kraken). The price could start a recovery wave if the bulls defend $150 or $145. Solana Price Dips Heavily Solana price failed to remain stable above $180 and started a fresh decline, like Bitcoin and Ethereum . SOL declined below the $175 and $165 support levels. The price gained bearish momentum below $160. A low was formed at $145, and the price is now consolidating losses. The price recovered a few points above the 23.6% Fib retracement level of the downward move from the $188 swing high to the $145 low. Solana is now trading below $160 and the 100-hourly simple moving average. On the upside, immediate resistance is near the $158 level. There is also a key bearish trend line forming with resistance at $158 on the hourly chart of the SOL/USD pair. The next major resistance is near the $162 level. The main resistance could be $166 and the 50% Fib retracement level of the downward move from the $188 swing high to the $145 low. A successful close above the $166 resistance zone could set the pace for another steady increase. The next key resistance is $175. Any more gains might send the price toward the $180 level. Another Decline In SOL? If SOL fails to rise above the $166 resistance, it could continue to move down. Initial support on the downside is near the $155 zone. The first major support is near the $150 level. A break below the $150 level might send the price toward the $145 support zone. If there is a close below the $145 support, the price could decline toward the $132 support in the near term. Technical Indicators Hourly MACD – The MACD for SOL/USD is gaining pace in the bearish zone. Hourly Hours RSI (Relative Strength Index) – The RSI for SOL/USD is below the 50 level. Major Support Levels – $155 and $150. Major Resistance Levels – $162 and $166. CoinOtag


BTC
-

China Pauses U.S. Tariffs to Ease Trade Disputes
2 saat önce