10 hours ago
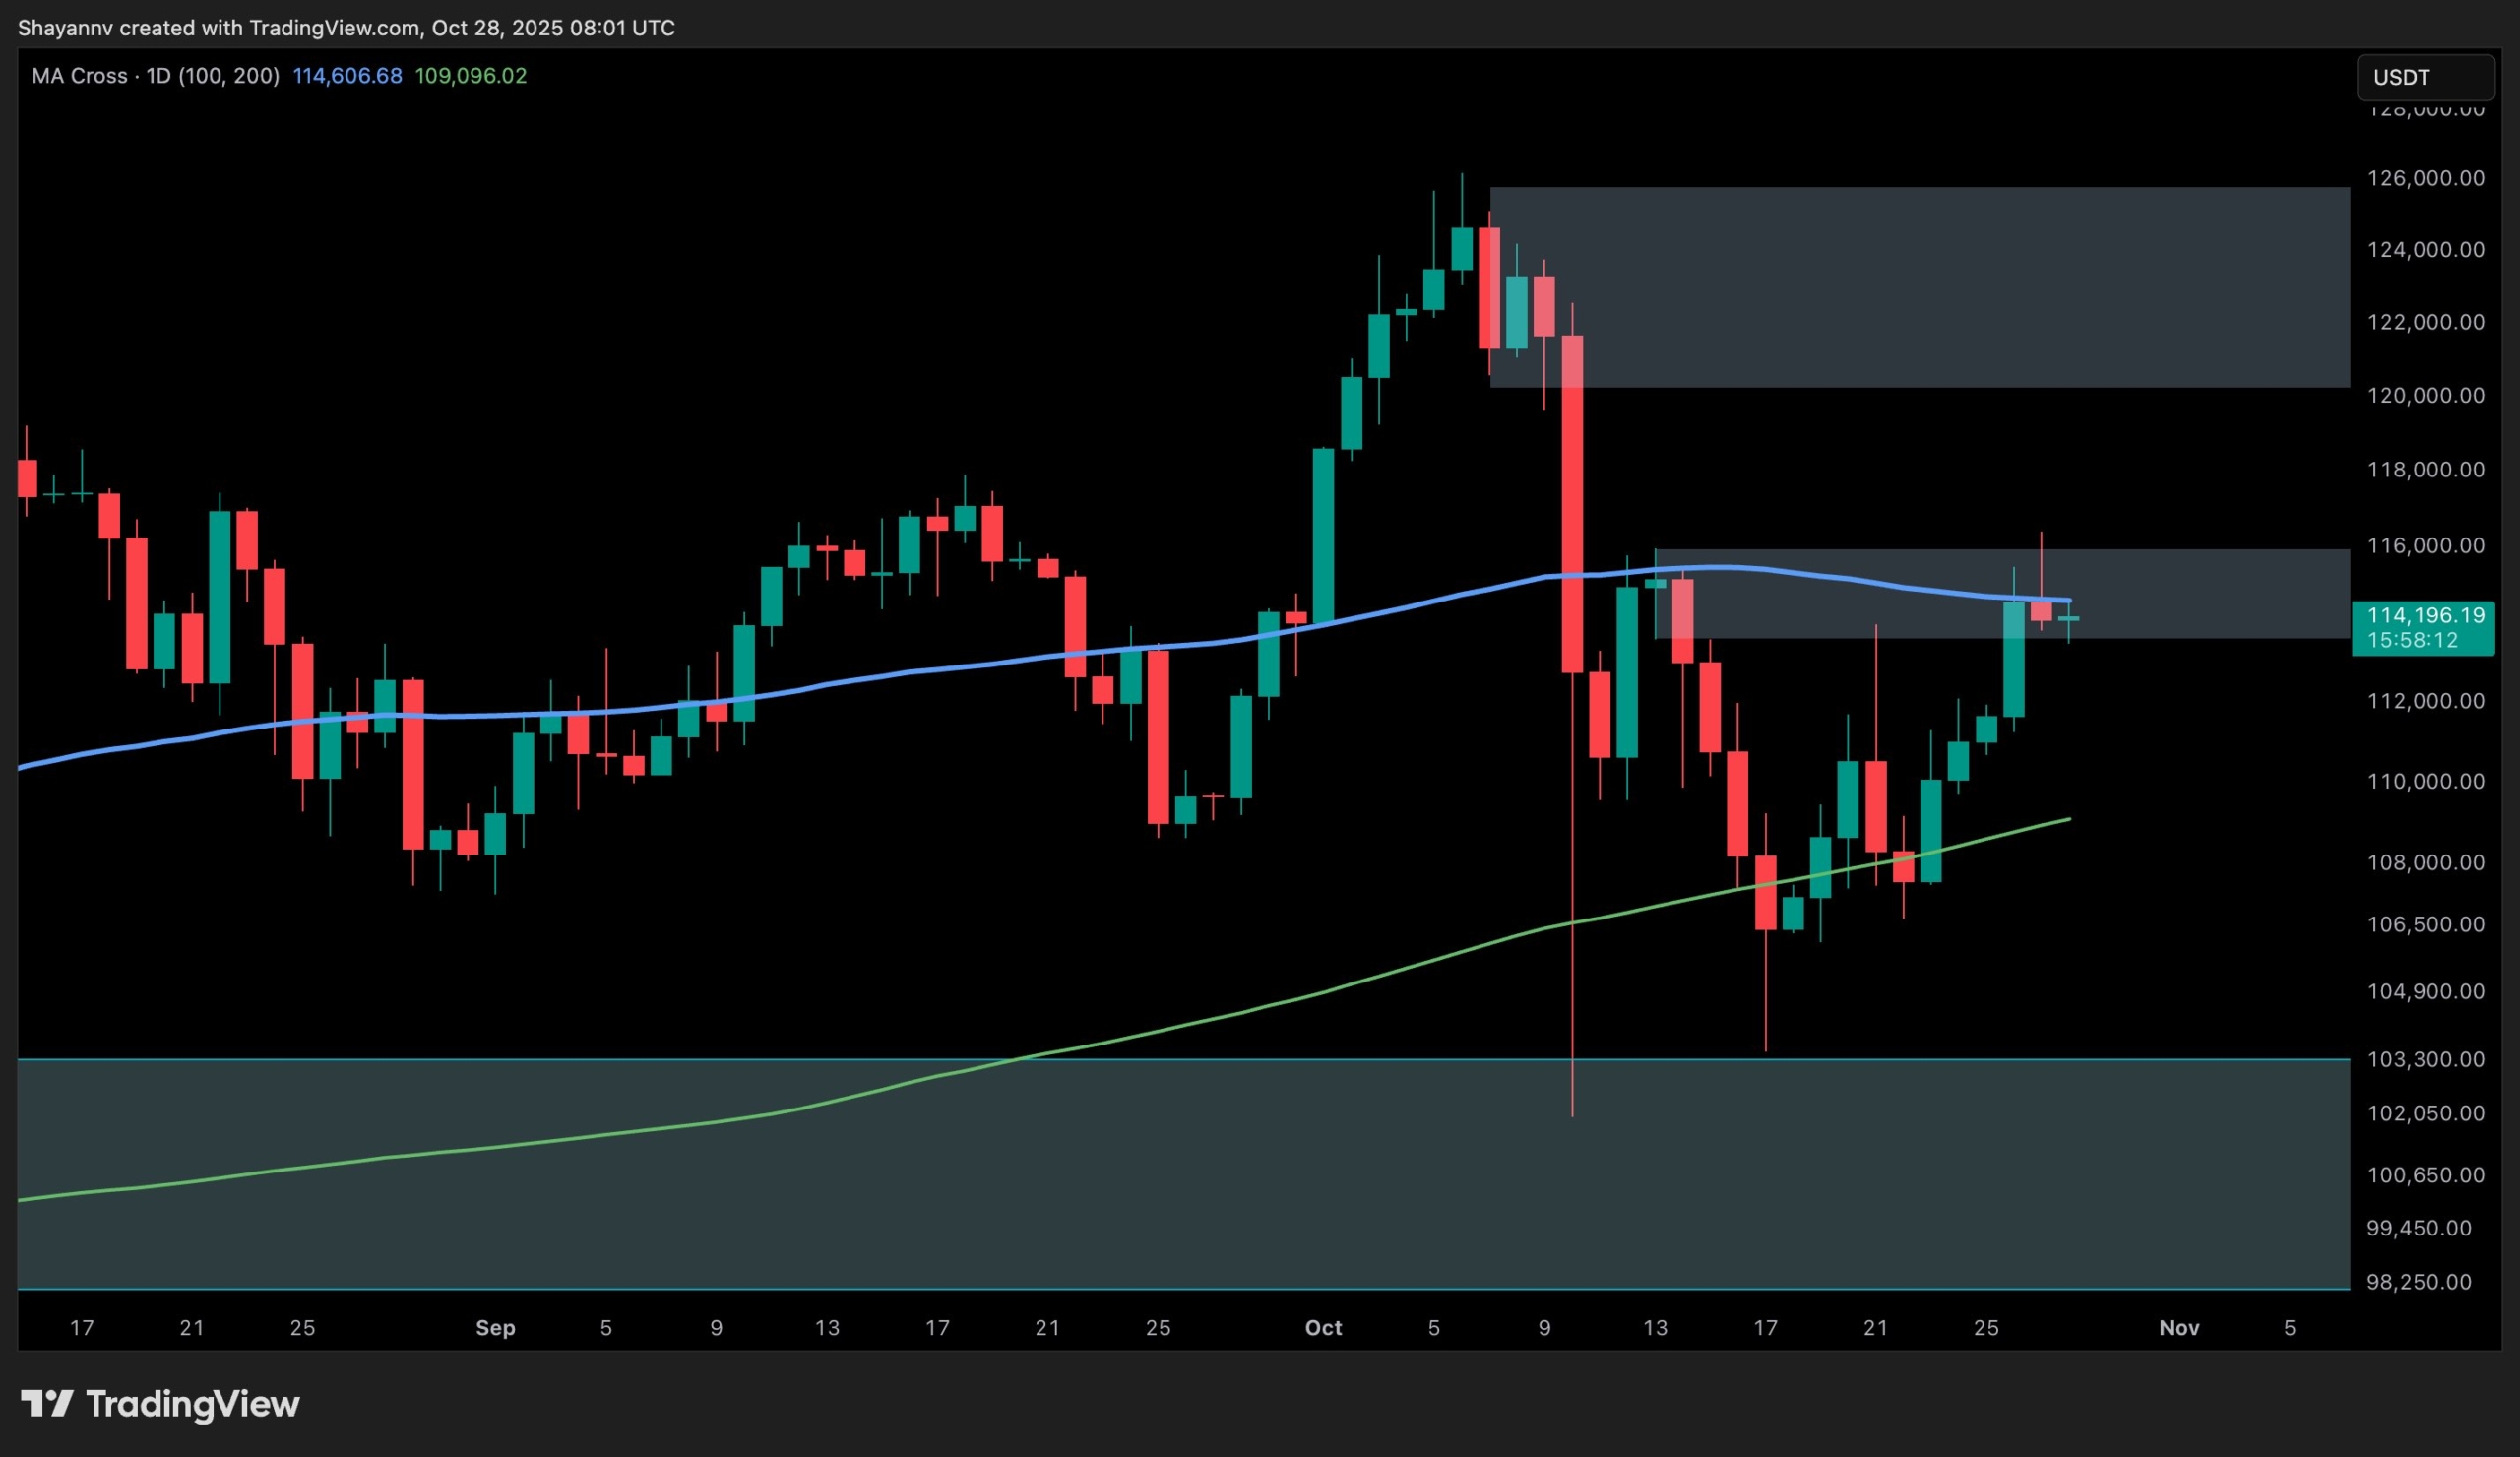
Bitcoin (BTC) remains in a consolidation phase following the October 10 market crash, with bulls now pushing prices back above critical resistance levels. The recovery toward the $115K region has renewed optimism across the market, as the monthly close approaches and traders anticipate a possible shift in momentum. According to several analysts, this phase may represent the calm before the storm, a typical pattern seen before large directional moves. On-chain data and liquidity metrics suggest that capital is accumulating on the sidelines, ready to rotate into Bitcoin once clear bullish confirmation appears. If BTC manages to break above its previous all-time high (ATH), analysts believe it could trigger a new impulsive phase, similar to the post-accumulation surges observed in earlier bull cycles. Funding rates remain stable, suggesting that leverage is still moderate — a positive sign for a potential sustainable rally. Furthermore, liquidity concentration near key resistance zones indicates that a decisive breakout could quickly attract institutional and retail inflows. As volatility compresses and the market digests recent shocks, Bitcoin appears to be building strength for its next major move, with liquidity and sentiment aligned for a possible bullish continuation into November. Bitcoin Liquidity Builds as Stablecoin Supply Ratio Hits Cycle Lows According to Glassnode data , the Stablecoin Supply Ratio (SSR) Oscillator remains near its cycle lows, signaling a period of high stablecoin liquidity relative to Bitcoin’s market capitalization. In simple terms, this means there is a substantial amount of buying power sitting in stablecoins — the digital cash reserves of the crypto ecosystem — waiting for the right moment to re-enter the market. Historically, such conditions have often preceded major bullish phases for Bitcoin. When stablecoin liquidity is high, it implies that investors are holding capital in readiness rather than fleeing the market entirely. Once market confidence strengthens, these reserves typically flow back into risk assets like Bitcoin and Ethereum, creating a wave of bid-side pressure that fuels upward momentum. At the moment, Bitcoin is trading just above $115K, still recovering from the October 10 crash that disrupted short-term sentiment. Yet, despite recent volatility, liquidity indicators such as the SSR suggest that the market’s underlying structure remains healthy. Stablecoins now represent a significant portion of total crypto liquidity, and their abundance indicates that participants are positioned to buy the dip once conviction returns. Analysts interpret the current SSR trend as a bullish latent signal, reflecting a macro setup similar to those seen before previous expansion phases. If Bitcoin manages to stabilize and reclaim higher levels, the excess liquidity sitting in stablecoins could act as a catalyst for a strong impulse move, driving BTC toward a new cycle high. In this context, the SSR’s position near historical lows might represent not just a sign of caution, but an early signal that the next major liquidity-driven rally could already be forming beneath the surface. BTC Retests Resistance as Bulls Regain Control Bitcoin (BTC) continues its recovery, trading around $115,300 after a strong rebound from the $108K region earlier this month. The 12-hour chart reveals a clear upward structure forming, with bulls now challenging the $117,500 resistance level, a zone that has repeatedly acted as both support and rejection in recent months. BTC is currently trading above the 50-day and 100-day moving averages, signaling renewed short-term strength, while the 200-day MA around $113K has turned into a solid support base. A sustained breakout above $117.5K could open the door for a move toward $120K–$123K, confirming a short-term impulsive phase and potentially restoring investor confidence after weeks of consolidation. Volume has been rising alongside price, suggesting genuine buying interest rather than speculative spikes. However, BTC’s momentum remains sensitive to macroeconomic factors and liquidity conditions. A rejection at this level could lead to another retest of $111K, maintaining the consolidation range. Overall, Bitcoin’s current technical structure looks constructively bullish. If price manages to close above $117.5K with strong volume, it would likely confirm the end of the post-crash stagnation and set the stage for a new leg higher, supported by improving liquidity and market sentiment. Featured image from ChatGPT, chart from TradingView.com
Bitcoinist
You can visit the page to read the article.
Source: Bitcoinist
Tags :
Uncategorized bitcoin Bitcoin analysis Bitcoin liquidation bitcoin news bitcoin price btc BTCUSDT SSR SSR oscillator
Disclaimer: The opinion expressed here is not investment advice – it is provided for informational purposes only. It does not necessarily reflect the opinion of BitMaden. Every investment and all trading involves risk, so you should always perform your own research prior to making decisions. We do not recommend investing money you cannot afford to lose.
Dominant Force: BlackRock’s Crucial Impact on Spot Bitcoin ETF Flows Revealed

BitcoinWorld Dominant Force: BlackRock’s Crucial Impact on Spot Bitcoin ETF Flows Revealed The world of cryptocurrency investment is buzzing, and at the heart of the excitement lies the incredible growth of spot Bitcoin ETF flows . But who is truly at the helm of this financial revolution? Recent analysis points to one undeniable leader: BlackRock. Their monumental presence is reshaping the landscape of digital asset investment, drawing unprecedented capital into Bitcoin. Understanding the Surge in Spot Bitcoin ETF Flows When we talk about spot Bitcoin ETF flows , we’re referring to the net capital moving into exchange-traded funds that hold actual Bitcoin. This mechanism allows traditional investors to gain exposure to Bitcoin’s price movements without directly owning or managing the cryptocurrency itself. It’s a game-changer for institutional adoption and mainstream access. According to K33 Research analyst Vetle Lunde , the numbers tell a compelling story. This year, the total net inflows across all spot Bitcoin ETFs reached an impressive $26.9 billion. However, a closer look reveals a startling fact: BlackRock’s own IBIT fund alone recorded $28.1 billion in inflows. BlackRock’s IBIT: $28.1 billion in inflows. Total Spot Bitcoin ETF Market: $26.9 billion in net inflows. This data means that without BlackRock’s contribution, the entire spot Bitcoin ETF category would have actually experienced a net outflow. This highlights BlackRock’s crucial role in sustaining and driving market interest and capital accumulation. Why BlackRock Dominates the Spot Bitcoin ETF Landscape So, what makes BlackRock’s IBIT so successful in attracting such significant spot Bitcoin ETF flows ? Several factors contribute to their dominant position: Brand Trust and Reputation: BlackRock is a global asset management behemoth with a long-standing reputation for reliability and financial prowess. This instills confidence in institutional and retail investors alike. Extensive Distribution Network: Their vast network allows for broad access to financial advisors and wealth managers, making it easier for clients to allocate funds to IBIT. Competitive Fees: While not always the lowest, BlackRock often positions its products competitively, attracting cost-conscious investors. Proactive Marketing and Investor Education: BlackRock has been effective in communicating the benefits and legitimacy of Bitcoin as an asset class. The sheer scale of BlackRock’s operations and their strategic entry into the Bitcoin ETF market have created a powerful flywheel effect, continually drawing in more capital and reinforcing their leadership. The Broader Implications for Crypto Markets and Future Spot Bitcoin ETF Flows BlackRock’s outsized influence has significant implications for the broader cryptocurrency market. Their success validates Bitcoin as a legitimate investment vehicle, potentially encouraging more traditional financial institutions to explore digital assets. Moreover, it sets a high bar for competitors. Lunde also touched upon the nascent spot altcoin ETF market. He noted that while BlackRock’s decision not to enter this space could allow other competitors to secure funds, the growth of that market will likely be limited without the asset manager’s involvement. This suggests that the institutional backing and brand power that BlackRock brings are paramount for substantial market expansion, especially concerning spot Bitcoin ETF flows . What does this mean for you, the investor? It means watching institutional movements, especially from giants like BlackRock, is more important than ever. Their actions often signal broader market trends and potential shifts in investment sentiment. Keep an eye on evolving regulatory landscapes, as these will also play a crucial role in shaping future inflows. Looking Ahead: What’s Next for Bitcoin ETFs? The dominance of BlackRock in driving spot Bitcoin ETF flows is a clear indicator of a maturing market. As institutional interest continues to grow, we can anticipate several developments: Increased Competition: Other asset managers will undoubtedly strive to capture a larger share of the market, potentially leading to more innovative product offerings and lower fees. Enhanced Regulatory Clarity: The success of spot Bitcoin ETFs could pave the way for clearer regulatory frameworks, further legitimizing the asset class. Broader Adoption: As more investors gain comfortable access to Bitcoin through ETFs, its overall adoption and integration into traditional portfolios are likely to accelerate. Ultimately, BlackRock’s remarkable performance underscores a pivotal moment for Bitcoin. Their ability to attract and sustain such massive capital inflows demonstrates the enduring appeal and growing acceptance of digital assets within mainstream finance. The journey of Bitcoin ETFs is just beginning, and BlackRock is certainly leading the charge. Frequently Asked Questions (FAQs) Q1: What is a spot Bitcoin ETF? A: A spot Bitcoin ETF is an exchange-traded fund that directly holds Bitcoin. It allows investors to gain exposure to Bitcoin’s price movements through a traditional investment vehicle without needing to buy and store the cryptocurrency themselves. Q2: Why is BlackRock’s IBIT so significant for spot Bitcoin ETF flows? A: BlackRock’s IBIT has recorded significantly higher inflows ($28.1 billion) than the total net inflows for the entire spot Bitcoin ETF category ($26.9 billion) this year. This indicates that without IBIT, the category would have seen net outflows, highlighting BlackRock’s crucial role in driving capital into these products. Q3: Who is Vetle Lunde? A: Vetle Lunde is an analyst at K33 Research , a firm that provides insightful analysis on digital asset markets. He is the source of the data and analysis regarding BlackRock’s impact on spot Bitcoin ETF flows mentioned in this article. Q4: How does BlackRock’s involvement impact the future of altcoin ETFs? A: According to analyst Vetle Lunde, BlackRock’s decision not to enter the spot altcoin ETF space could limit the growth of that market compared to spot Bitcoin ETFs. BlackRock’s brand trust and distribution network are seen as crucial for significant market expansion. Q5: What are the key takeaways for investors from BlackRock’s performance? A: Investors should recognize BlackRock’s success as a strong validation of Bitcoin as an asset class. It suggests increasing institutional adoption and market maturity. Monitoring such large institutional movements can offer insights into broader market trends and potential future investment opportunities in digital assets. Did you find this analysis insightful? Share this article with your network on social media to spread awareness about the significant impact of institutional players like BlackRock on the evolving cryptocurrency market! To learn more about the latest crypto market trends, explore our article on key developments shaping Bitcoin institutional adoption. This post Dominant Force: BlackRock’s Crucial Impact on Spot Bitcoin ETF Flows Revealed first appeared on BitcoinWorld . Bitcoinist

Cup-and-Handle Ignites XRP — $4 in Sight Amid 20-Day Moving Average Reclaim
XRP Cup and Handle Formation Signals Potential Surge Toward $4 According to market analyst Steph is Crypto, XRP is showing early signs of a bullish breakout, as technical charts reveal a classic cup and handle formation. This pattern, widely recognized by traders as a precursor to upward momentum, suggests that XRP could be preparing for a significant price run, potentially targeting the $4 level. The cup and handle pattern features a rounded base (the cup) followed by a brief consolidation (the handle), signaling renewed bullish momentum after a period of correction. For XRP, the extended cup reflects weeks of accumulation and stabilization, while the forming handle suggests a short pause before a potential breakout. Notably, rising trading volumes strengthen the bullish outlook, with on-chain data revealing accumulation by large holders, or “smart money,” ahead of a potential rally. Supporting this sentiment, both the RSI and MACD are turning firmly bullish, signaling growing momentum and an increased likelihood of continued price gains. Why is this a major move? Well, If XRP breaks above the handle, it could surge toward $4, setting a new all-time high beyond $3.65 and signaling a full recovery from past lows. XRP Signals Potential Bullish Reversal Amid Technical Momentum According to market commentator Justcryptopays, XRP is showing early signs of a potential reversal, igniting renewed optimism among traders and investors. The analyst highlights two key technical indicators suggesting that bullish momentum may be building in the near term. First, the Moving Average Convergence Divergence (MACD) has recently crossed above its signal line, a classic technical indicator that often signals a shift from bearish to bullish sentiment. Historically, such crossovers are viewed as early warnings of potential upward price movement, attracting traders looking for breakout opportunities. In XRP’s case, this MACD crossover indicates that momentum is starting to favor buyers, suggesting a reversal could be underway after the recent consolidation phase. Second, XRP’s price has successfully moved above the 20-day moving average, another significant technical milestone. The 20-day moving average acts as a short-term trend gauge, and crossing above it often implies that buying pressure is intensifying. When combined with the MACD crossover, this development strengthens the case for a bullish shift, signaling that the market may be ready to test higher resistance levels. What is expected? Well, while the bullish signals are promising, a keen eye should be given for sustained price action above the moving average. A confirmed hold could trigger a stronger rally fueled by momentum buyers, while failure to maintain this level may lead to a retest of key support zones critical to the bullish outlook. Conclusion XRP’s emerging cup and handle pattern signals the potential start of a strong bullish phase, putting the $4 target within reach. Backed by rising on-chain accumulation, bullish technical indicators, and renewed institutional confidence, XRP appears poised to regain momentum. A sustained breakout could not only confirm the pattern but also mark a broader resurgence in market confidence for the digital asset. XRP’s recent MACD crossover and breakout above the 20-day moving average signal a potential shift from consolidation to accumulation. These bullish indicators highlight strengthening buyer confidence and hint at an emerging market reversal, pending confirmation through sustained price momentum. Bitcoinist

BLOCKCHAIN
-

Stablecoins and RWAs follow Bitcoin this Uptober
29 dakika önce -

Metaplanet Boosts Efficiency with Bold Buyback Plan
16 dakika önce