11 hours ago
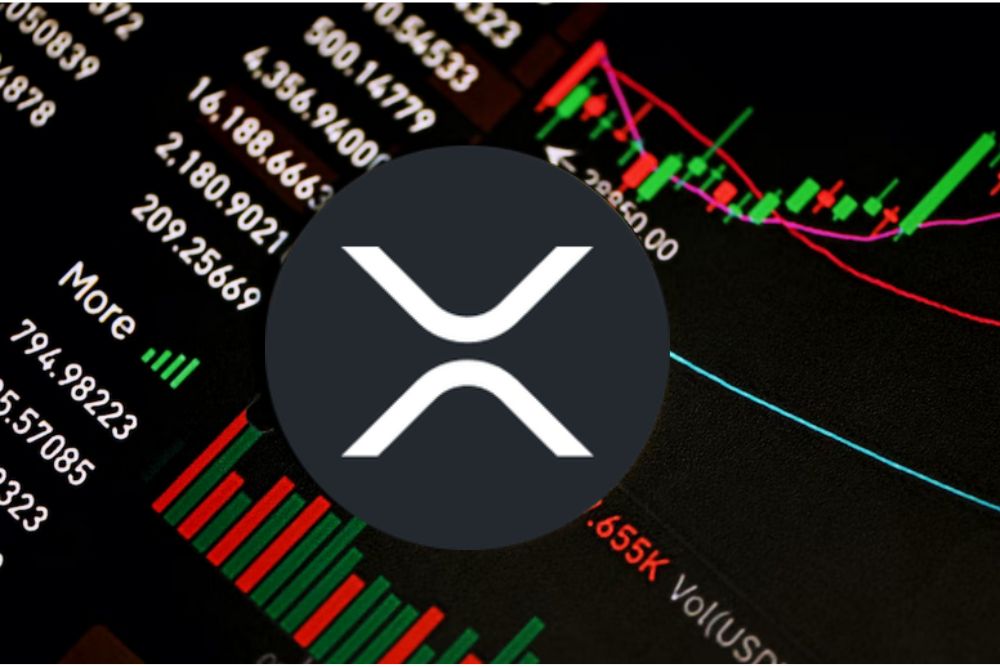
Market momentum is teetering between chaos and opportunity. Across global markets, traders are navigating volatility that feels less like analysis and more like survival — a fast-paced ride with the driver blindfolded and the speedometer stuck at 100 miles per hour. From fiscal gridlock in Washington to rising geopolitical tension between China and Russia over Ukraine, uncertainty has once again become the market’s dominant theme. But amid the turbulence, one crypto asset — XRP — is quietly forming a structure that seasoned traders say could dictate its next explosive move. Egrag Crypto’s Take: XRP Capturing the Liquidity Prominent technical analyst Egrag Crypto believes XRP is entering a decisive “liquidity grab” phase . Drawing from the Gemini XRP/USD chart, which he calls the cleanest view of XRP’s true market structure, Egrag notes that the current move is “just filling in the wick”, a normal behavior during liquidity capture. According to him, many exchanges show distorted patterns due to thin order books and irregular volume profiles, but Gemini’s data provides a more accurate read of the unfolding breakout. #XRP : Capturing the Liquidity! I`m utilizing the #Gemini chart because it aligns perfectly with the breakout structure I mentioned earlier. check out my previous post here: https://t.co/5A9dJAPC8r #XRP Just filling in the Wick, this is the nature of Liquidity grabbing… pic.twitter.com/JHHZYM8xGb — EGRAG CRYPTO (@egragcrypto) October 17, 2025 He explains that XRP’s recent wick-fill reflects the classic nature of liquidity grabs — sweeping stop-losses, reclaiming zones of imbalance, and setting the stage for directional momentum. On Gemini, XRP has been consolidating within a tight range between $2.30 and $2.60, an area Egrag believes represents the final wick-fill before a potential breakout continuation. Macro Headwinds: A Market Running Blind Egrag’s market analogy — a bus driven blindfolded at 100 mph — captures the sense of instability gripping global markets. The ongoing U.S. government shutdown , coupled with the China-Russia-Ukraine standoff, has fractured investor confidence and muted institutional flows. The absence of macro clarity is steering capital toward safe-haven assets like gold, which recently posted its strongest 40-day rally in years. Egrag warns that this dynamic could shift abruptly once quantitative easing (QE) returns and U.S.-China relations stabilize, setting the stage for a dramatic resurgence in risk-on assets like XRP and equities. “Markets thrive on certainty,” he says, “and that’s what’s missing right now.” We are on X, follow us to connect with us :- @TimesTabloid1 — TimesTabloid (@TimesTabloid1) June 15, 2025 Gold, Risk Assets, and the Final Leg of the Cycle Egrag also draws a striking parallel between gold’s performance and what he expects next from cryptocurrencies. “Have you noticed how gold has been acting like a meme coin, pumping for the last 40 days?” he asks. In his view, this mirrors the speculative enthusiasm that could soon flood back into crypto markets once macro tensions ease. He’s currently rotating capital — selling portions of his gold holdings to rebuy at lower levels — while positioning for what he calls “the last leg of risk-on assets.” For traders, the message is clear: the interplay between liquidity grabs, macro policy shifts, and sentiment reversals could make XRP one of the most technically charged assets in the coming weeks. The Bottom Line Egrag Crypto’s analysis underlines a simple truth — in volatile markets, liquidity is both the weapon and the prize. XRP’s ongoing consolidation could be the calm before an explosive move , as liquidity pools reset and risk appetite prepares to shift. Whether the next chapter brings parabolic growth or another shakeout, one thing is certain: XRP’s liquidity capture phase has traders watching every wick. Disclaimer : This content is meant to inform and should not be considered financial advice. The views expressed in this article may include the author’s personal opinions and do not represent Times Tabloid’s opinion. Readers are urged to do in-depth research before making any investment decisions. Any action taken by the reader is strictly at their own risk. Times Tabloid is not responsible for any financial losses. Follow us on Twitter , Facebook , Telegram , and Google News The post XRP Breakout Alert: Inside Egrag Crypto’s Liquidity Grab Analysis appeared first on Times Tabloid .
TimesTabloid
You can visit the page to read the article.
Source: TimesTabloid
Tags :
Cryptocurrency News XRP XRP Price XRP Price Analysis
Disclaimer: The opinion expressed here is not investment advice – it is provided for informational purposes only. It does not necessarily reflect the opinion of BitMaden. Every investment and all trading involves risk, so you should always perform your own research prior to making decisions. We do not recommend investing money you cannot afford to lose.
Shiba Inu (SHIB) Could Crash Further. Here’s Why

Shiba Inu is facing continued selling pressure, with several technical indicators suggesting that the recent downturn may persist in the short term. The token has dropped by 8.5% in the last 24 hours, mirroring a broader decline across the crypto market. This drop has pushed Shiba Inu’s price further down, adding another zero to its value and signaling a potential extension of the bearish trend. While investors are eager to know whether SHIB can stage a short-term rebound, a closer look at the technical indicators reveals a mixed outlook, with a clear bias toward continued weakness. Shiba Inu Technical Outlook An overview of SHIB’s key oscillators shows that most remain in neutral territory, reflecting indecision among market participants. Out of 11 tracked oscillators, eight currently signal neutrality, two indicate selling pressure, and one reflects a potential buying opportunity. The Relative Strength Index (RSI), one of the most watched indicators, stands at 45.90 on the weekly chart, roughly at the midpoint between overbought (70) and oversold (30) levels. This positioning suggests that while the token has experienced notable corrections, it has not yet entered deeply oversold territory. Moreover, the RSI continues to move in line with price action, showing no signs of bullish or bearish divergence that might hint at an upcoming reversal. However, other indicators tell a more cautionary story. The Moving Average Convergence Divergence (MACD) recently issued a sell signal following a bearish crossover between the MACD line and the signal line. This crossover is often interpreted as a precursor to further downward movement. The MACD histogram has also turned red, reinforcing the view that bearish sentiment may remain dominant in the near term. We are on X, follow us to connect with us :- @TimesTabloid1 — TimesTabloid (@TimesTabloid1) June 15, 2025 Moving Averages Reinforce the Bearish Bias A deeper analysis of moving averages adds weight to the bearish outlook. Among 15 key moving averages examined, 14 currently show a sell signal, while only one remains neutral. SHIB is now trading below all major short, mid, and long-term moving averages, ranging from the 10-week to the 200-week metrics. This alignment across timeframes typically suggests that sellers maintain control of the market and that a recovery might not yet be imminent. The combined readings from oscillators and moving averages summarize the broader technical picture for Shiba Inu as a strong sell. If this trend continues, SHIB could be on track for additional losses in the days ahead. Possible Downside Targets According to independent market analyst MMBTrader , $0.000006 represents a crucial support level for Shiba Inu. This zone previously acted as a rebound point during the October 10 market crash, when SHIB briefly touched that low before recovering. At the current market price of $0.00000937, a retest of that level would imply a decline of approximately 36%. If selling pressure continues to intensify, this area could again become a focal point for traders watching for signs of a possible stabilization or reversal. Overall, while a few oscillators show neutral readings, the broader collection of indicators, including moving averages and the MACD, suggests that Shiba Inu remains in a vulnerable technical position. The token’s inability to hold above key levels and the persistence of sell signals across multiple timeframes point to continued caution among traders . Unless market sentiment shifts decisively, SHIB could face additional downside before finding its next support base . Disclaimer : This content is meant to inform and should not be considered financial advice. The views expressed in this article may include the author’s personal opinions and do not represent Times Tabloid’s opinion. Readers are urged to do in-depth research before making any investment decisions. Any action taken by the reader is strictly at their own risk. Times Tabloid is not responsible for any financial losses. Follow us on Twitter , Facebook , Telegram , and Google News The post Shiba Inu (SHIB) Could Crash Further. Here’s Why appeared first on Times Tabloid . TimesTabloid

France’s Credit Downgrade May Raise Euro Borrowing Costs, Signals Need for Faster Fiscal Consolidation
France’s S&P Global Ratings downgrade to A+ from AA‑ minus signals a slower fiscal consolidation trajectory, raising borrowing costs and widening the debt‑to‑GDP gap, while maintaining a stable medium‑term outlook. TimesTabloid

CRYPTOCURRENCY


CRYPTOCURRENCY
-

Bitcoin Is At Trend Support
39 dakika önce