4 hours ago
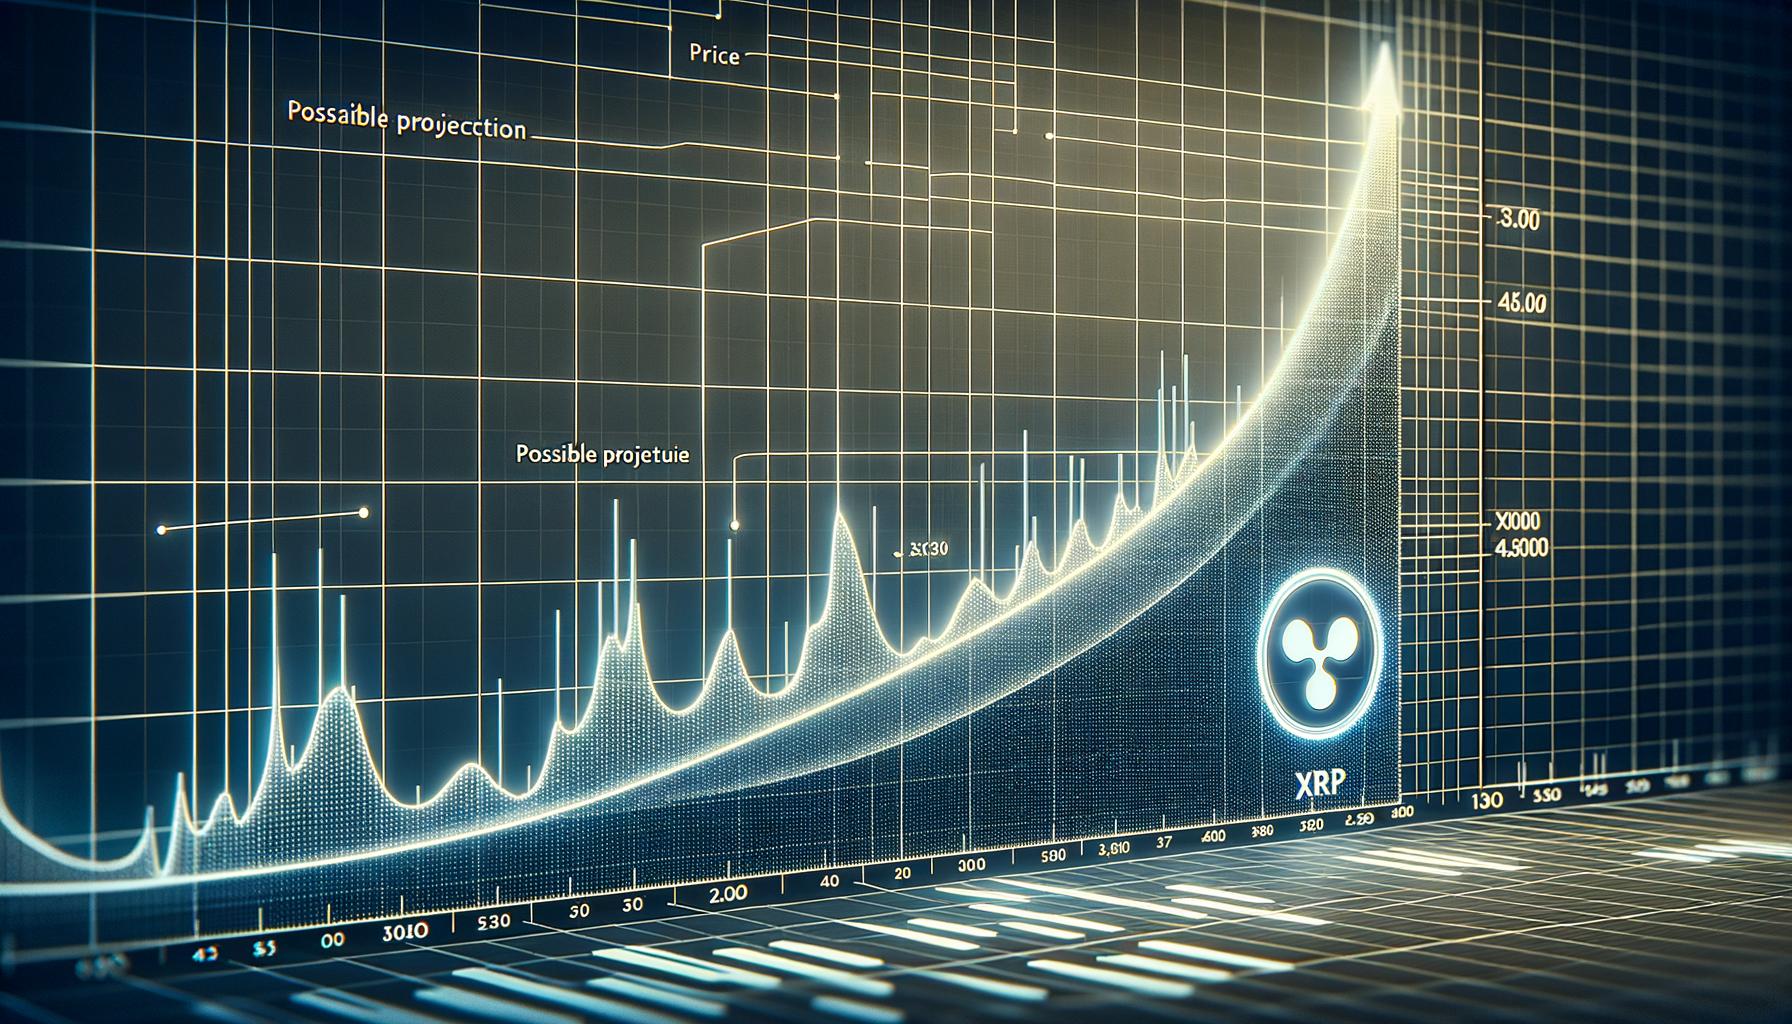
XRP price started a fresh increase above $2.50. The price is now showing positive signs and might rise further if it clears the $2.6880 resistance. XRP price gained pace for a move above $2.50 and $2.550. The price is now trading above $2.50 and the 100-hourly Simple Moving Average. There is a bullish trend line forming with support at $2.60 on the hourly chart of the XRP/USD pair (data source from Kraken). The pair could start a fresh increase if it clears the $2.6880 resistance. XRP Price Holds Support XRP price started a fresh increase after it settled above $2.40, like Bitcoin and Ethereum . The price surpassed the $2.420 and $2.50 resistance levels. The bulls were able to push the price above $2.550 and $2.65. A high was formed at $2.6972 and the price is now consolidating gains above the 23.6% Fib retracement level of the recent move from the $2.327 swing low to the $2.6972 high. The price is now trading below $2.60 and the 100-hourly Simple Moving Average. There is a bullish trend line forming with support at $2.60 on the hourly chart of the XRP/USD pair. If there is a fresh upward move, the price might face resistance near the $2.650 level. The first major resistance is near the $2.6880 level, above which the price could rise and test $2.70. A clear move above the $2.70 resistance might send the price toward the $2.7650 resistance. Any more gains might send the price toward the $2.80 resistance. The next major hurdle for the bulls might be near $2.880. Downside Correction? If XRP fails to clear the $2.6880 resistance zone, it could start a fresh decline. Initial support on the downside is near the $2.60 level. The next major support is near the $2.5650 level. If there is a downside break and a close below the $2.5650 level, the price might continue to decline toward $2.5120 or the 50% Fib retracement level of the recent move from the $2.327 swing low to the $2.6972 high. The next major support sits near the $2.4680 zone, below which the price could continue lower toward $2.420. Technical Indicators Hourly MACD – The MACD for XRP/USD is now losing pace in the bullish zone. Hourly RSI (Relative Strength Index) – The RSI for XRP/USD is now above the 50 level. Major Support Levels – $2.60 and $2.580. Major Resistance Levels – $2.650 and $2.6880.
NewsBTC
You can visit the page to read the article.
Source: NewsBTC
Tags :
XRP Ripple XRPBTC XRPUSD xrpusdt
Disclaimer: The opinion expressed here is not investment advice – it is provided for informational purposes only. It does not necessarily reflect the opinion of BitMaden. Every investment and all trading involves risk, so you should always perform your own research prior to making decisions. We do not recommend investing money you cannot afford to lose.
Bitcoin’s On-Chain Strength Signals Potential Rally Amid Muted Investor Sentiment

Bitcoin’s bottom appears to be forming after the recent crash, with 91% of BTC supply now profitable and short-term holders regaining confidence above $113,000. Whale accumulation and resilient on-chain metrics NewsBTC
Crucial BTC Perpetual Futures Data: Unveiling Market Sentiment
BitcoinWorld Crucial BTC Perpetual Futures Data: Unveiling Market Sentiment For anyone navigating the dynamic world of cryptocurrency, understanding market sentiment is absolutely crucial. Today, we’re diving deep into the fascinating realm of BTC perpetual futures , specifically examining the long/short ratio across the industry’s top three exchanges. This powerful metric offers a snapshot of how traders are positioning themselves, providing invaluable insights into prevailing bullish or bearish sentiment. Let’s uncover what these numbers truly reveal about the current state of Bitcoin’s derivatives market. Understanding the BTC Perpetual Futures Landscape First, what exactly are BTC perpetual futures ? Unlike traditional futures contracts with expiration dates, perpetual futures allow traders to hold positions indefinitely. They closely track the spot price of Bitcoin, making them a popular instrument for speculation and hedging. The long/short ratio, therefore, becomes a critical indicator. It represents the proportion of open long positions (bets that the price will rise) versus open short positions (bets that the price will fall) on these platforms. A higher percentage of long positions typically signals a bullish sentiment among traders, expecting Bitcoin’s price to increase. Conversely, a dominant short percentage indicates a bearish outlook. Monitoring this ratio provides a direct look into the collective mindset of futures traders, which can sometimes foreshadow broader market movements. What Do BTC Perpetual Futures Ratios Reveal About Current Sentiment? Over the past 24 hours, the overall picture for BTC perpetual futures shows a remarkably balanced sentiment. Across the top three exchanges ranked by open interest, the aggregate long/short ratio stands at: Overall: 50.52% long, 49.48% short This near 50/50 split suggests a moment of indecision or equilibrium in the market, where neither bulls nor bears hold a significant upper hand. However, a closer look at individual exchanges reveals subtle but important differences: Binance : 49.24% long, 50.76% short. On the world’s largest exchange, short positions slightly outweigh longs, indicating a marginally bearish lean among its futures traders. Gate.io : 49.45% long, 50.55% short. Similar to Binance, Gate.io also shows a slight preference for short positions, suggesting cautious sentiment. Bybit : 48.66% long, 51.34% short. Bybit displays the strongest bearish bias among the top three, with a more pronounced tilt towards short positions. These specific figures for BTC perpetual futures highlight that while the overall market might seem balanced, individual platforms can exhibit distinct sentiment trends. Traders often use these discrepancies to gauge localized market pressure. Why These BTC Perpetual Futures Insights Matter for Traders Understanding these long/short ratios is not just academic; it offers actionable insights for traders. Here’s why this data on BTC perpetual futures is so valuable: Gauging Market Conviction: When a ratio heavily skews one way, it shows strong conviction. However, extreme readings can sometimes act as a contrarian indicator, suggesting potential reversals. Informing Trading Strategies: Traders might adjust their positions based on whether the crowd is predominantly long or short. For instance, if the majority is heavily long, a savvy trader might consider the possibility of a “long squeeze” if the price starts to drop. Risk Management: By observing the sentiment across different exchanges, traders can better assess overall market risk and adjust their exposure to BTC perpetual futures accordingly. However, it’s vital to remember that these ratios are snapshots and not crystal balls. They reflect past activity and current positioning, not future price movements. Always combine this data with other technical and fundamental analysis for a comprehensive trading strategy. Conclusion: Navigating Sentiment with BTC Perpetual Futures Data The long/short ratio for BTC perpetual futures provides a powerful lens through which to view market sentiment. While the aggregated data suggests a relatively balanced playing field, a deeper dive into individual exchanges like Binance, Gate.io, and Bybit reveals nuanced bearish leanings. For astute traders, these insights are indispensable for understanding the collective psychology of the market and making more informed decisions. Always integrate this valuable data with a broader analytical framework to truly master the crypto trading landscape. Frequently Asked Questions About BTC Perpetual Futures Here are some common questions about BTC perpetual futures and their long/short ratios: What are BTC perpetual futures? BTC perpetual futures are derivative contracts that allow traders to speculate on the future price of Bitcoin without an expiration date. They aim to track the spot price of Bitcoin closely through a funding rate mechanism. How is the long/short ratio calculated? The long/short ratio is calculated by dividing the total number of open long positions by the total number of open short positions on a given exchange. It’s often expressed as a percentage of each. What does a high short ratio on BTC perpetual futures signify? A high short ratio indicates that a greater number of traders are betting on a price decrease for Bitcoin. This suggests a bearish sentiment among the futures market participants. Are these long/short ratios predictive of future BTC price movements? While these ratios provide valuable insights into current market sentiment, they are not direct predictors of future price movements. They are one of many indicators traders use to inform their strategies and should be combined with other forms of analysis. Which exchanges provide BTC perpetual futures trading? Many major cryptocurrency exchanges offer BTC perpetual futures trading. The top three by open interest mentioned in this article are Binance , Gate.io , and Bybit . Other notable platforms include OKX and KuCoin . Did you find these insights into BTC perpetual futures market sentiment helpful? Share this article with your fellow traders and crypto enthusiasts on social media to spread the knowledge! Your support helps us continue to provide valuable market analysis. To learn more about the latest Bitcoin market trends, explore our article on key developments shaping Bitcoin price action . This post Crucial BTC Perpetual Futures Data: Unveiling Market Sentiment first appeared on BitcoinWorld . NewsBTC
See Also

BTC


TRADING
-

XRP Climbs as Buyers Eye Key Resistance Levels
41 dakika önce