2 days ago
BlackRock asset tokenization plans to digitize traditional securities—converting ETFs, cash funds and other instruments into blockchain-based tokens to increase liquidity and broaden investor access, according to CEO Larry Fink. COINOTAG
CoinOtag
You can visit the page to read the article.
Source: CoinOtag
Tags :
News
Disclaimer: The opinion expressed here is not investment advice – it is provided for informational purposes only. It does not necessarily reflect the opinion of BitMaden. Every investment and all trading involves risk, so you should always perform your own research prior to making decisions. We do not recommend investing money you cannot afford to lose.
Pundit: XRP Charts Now Showing $1200 Just As I Predicted A Year Ago
Recent XRP chart projections have reignited interest among traders following new technical patterns that appear to match earlier forecasts made by crypto analyst Remi Relief (@RemiReliefX). What began as an ambitious target last year has now resurfaced in an updated analysis shared by other respected figures in the market. XRP Charts Now Showing A $1200 XRP Just As I Predicted A Year Ago To my surprise the XRP charts are now showing a “E Wave” to ~$1200 just as I predicted some time ago. In 2017 we did a 76,000% with no utility and based on pure speculation by retail. As of today all we… pic.twitter.com/mTaJ37ZrqM — The Real Remi Relief (@RemiReliefX) October 15, 2025 Renewed Focus on Four-digit Targets Remi Relief had previously outlined a bold scenario in which XRP could reach four-digit territory based on historical performance from the 2017-2018 cycle. In a post shared earlier, he noted that if XRP followed a similar pattern, it would peak at $1,695, representing what he described as a 76,700% increase in price. He added alternative estimates that ranged between 50,000% and 150,000% gains, depending on the length of the market cycle, with projected outcomes between $1,105 and $3,315 per XRP if similar conditions emerged. Those projections, initially viewed as highly speculative, have now gained renewed attention following a recent chart published by Amonyx (@amonbuy) on X. The chart shows a major Elliott Wave structure that extends to an “E Wave” target positioned around the $1,200 level, closely matching Remi Relief’s prior prediction. We are on X, follow us to connect with us :- @TimesTabloid1 — TimesTabloid (@TimesTabloid1) June 15, 2025 Elliott Wave Structure Suggests Major Upside Amonyx’s latest chart, posted on October 14, 2025, depicts XRP’s potential breakout path, highlighting percentage gains that echo the asset’s 2017 trajectory. The marked “E Wave” projection, visible near the upper Fibonacci extension levels, reaches approximately $1,195 to $1,200. The chart’s detailed Fibonacci structure reinforces the view that XRP may still have room for exponential appreciation if the pattern continues to unfold. Remi Relief reacted to the alignment of his earlier analysis with the new data, writing, “The XRP charts are now showing a ‘E Wave’ to ~$1200 just as I predicted some time ago.” He pointed out that the 2017 rally occurred without utility and based on retail speculation alone, suggesting that current market conditions, now supported by increasing institutional interest and practical utility, could strengthen XRP’s performance in the next major cycle . Warning Against Overconfidence Despite the optimistic projection, Relief advised caution, recalling the lessons of previous cycles. Both analysts are confident in a major rally, but even as bullish forecasts circulate, market timing remains unpredictable, and sudden downturns are always possible . He urged holders to take profit at different intervals to avoid repeating the mistakes of 2017 when he “left a quarter of a million dollars on the table” by not selling soon enough. Disclaimer : This content is meant to inform and should not be considered financial advice. The views expressed in this article may include the author’s personal opinions and do not represent Times Tabloid’s opinion. Readers are advised to conduct thorough research before making any investment decisions. Any action taken by the reader is strictly at their own risk. Times Tabloid is not responsible for any financial losses. Follow us on X , Facebook , Telegram , and Google News The post Pundit: XRP Charts Now Showing $1200 Just As I Predicted A Year Ago appeared first on Times Tabloid . CoinOtag
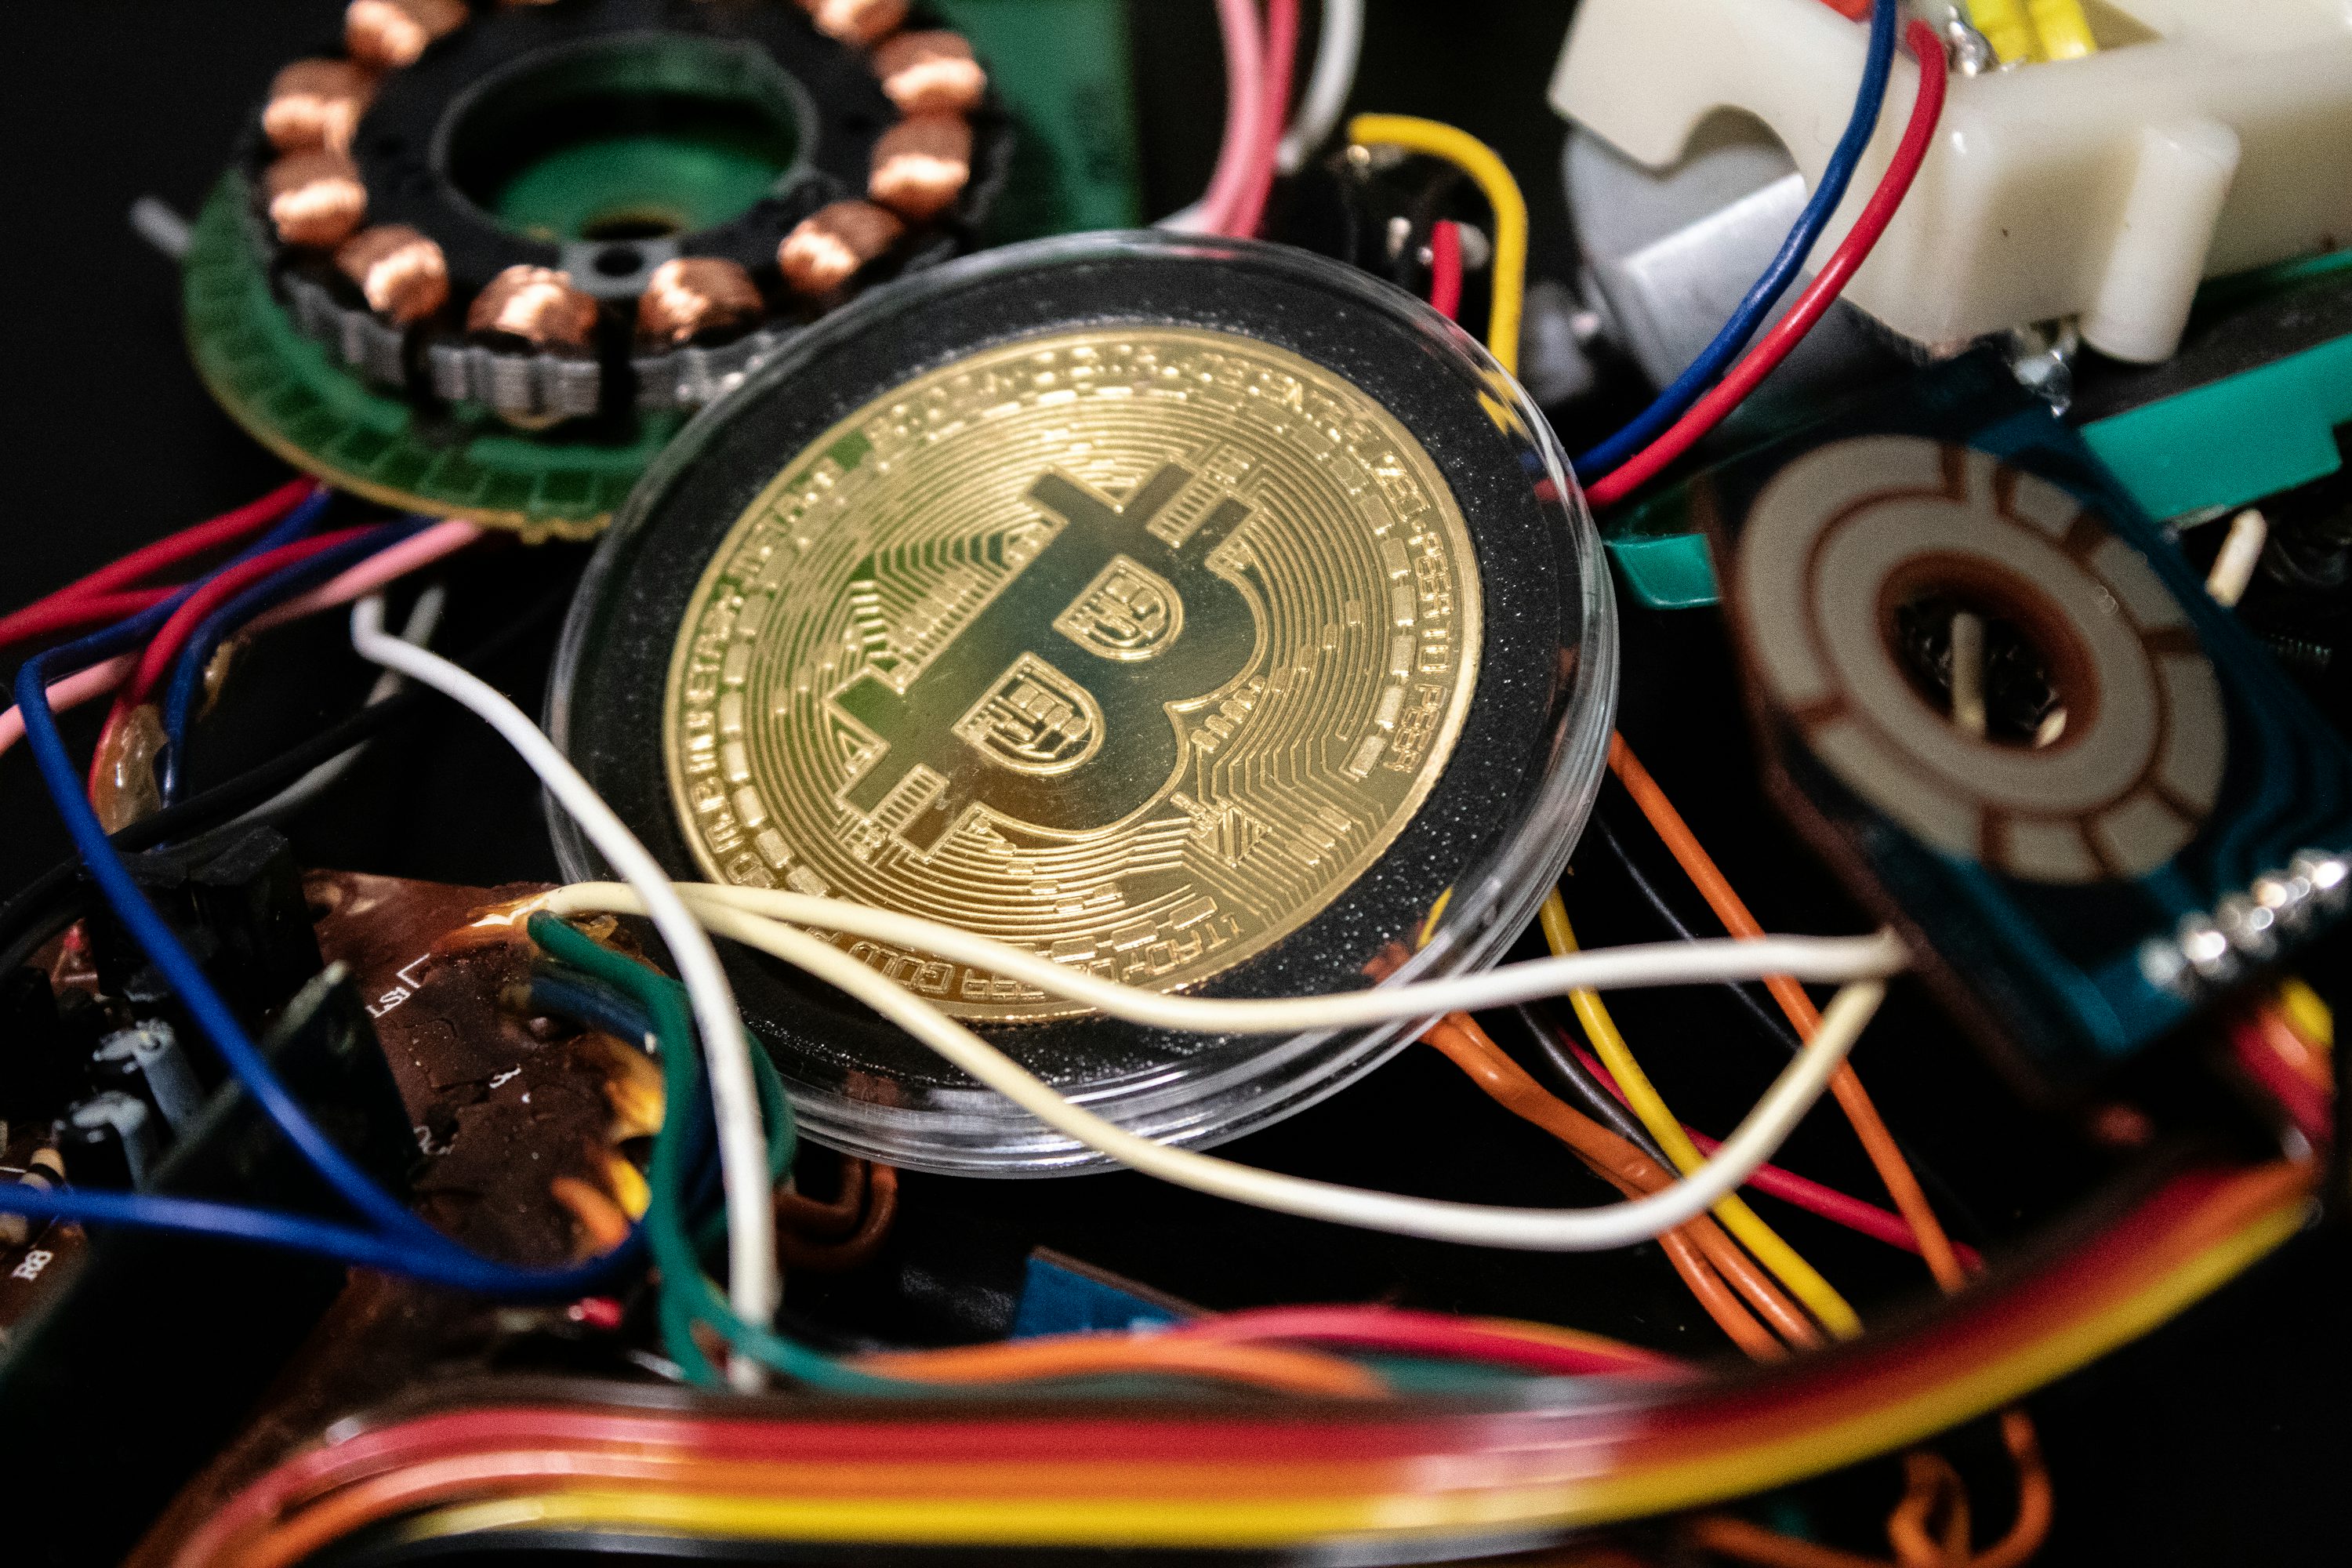
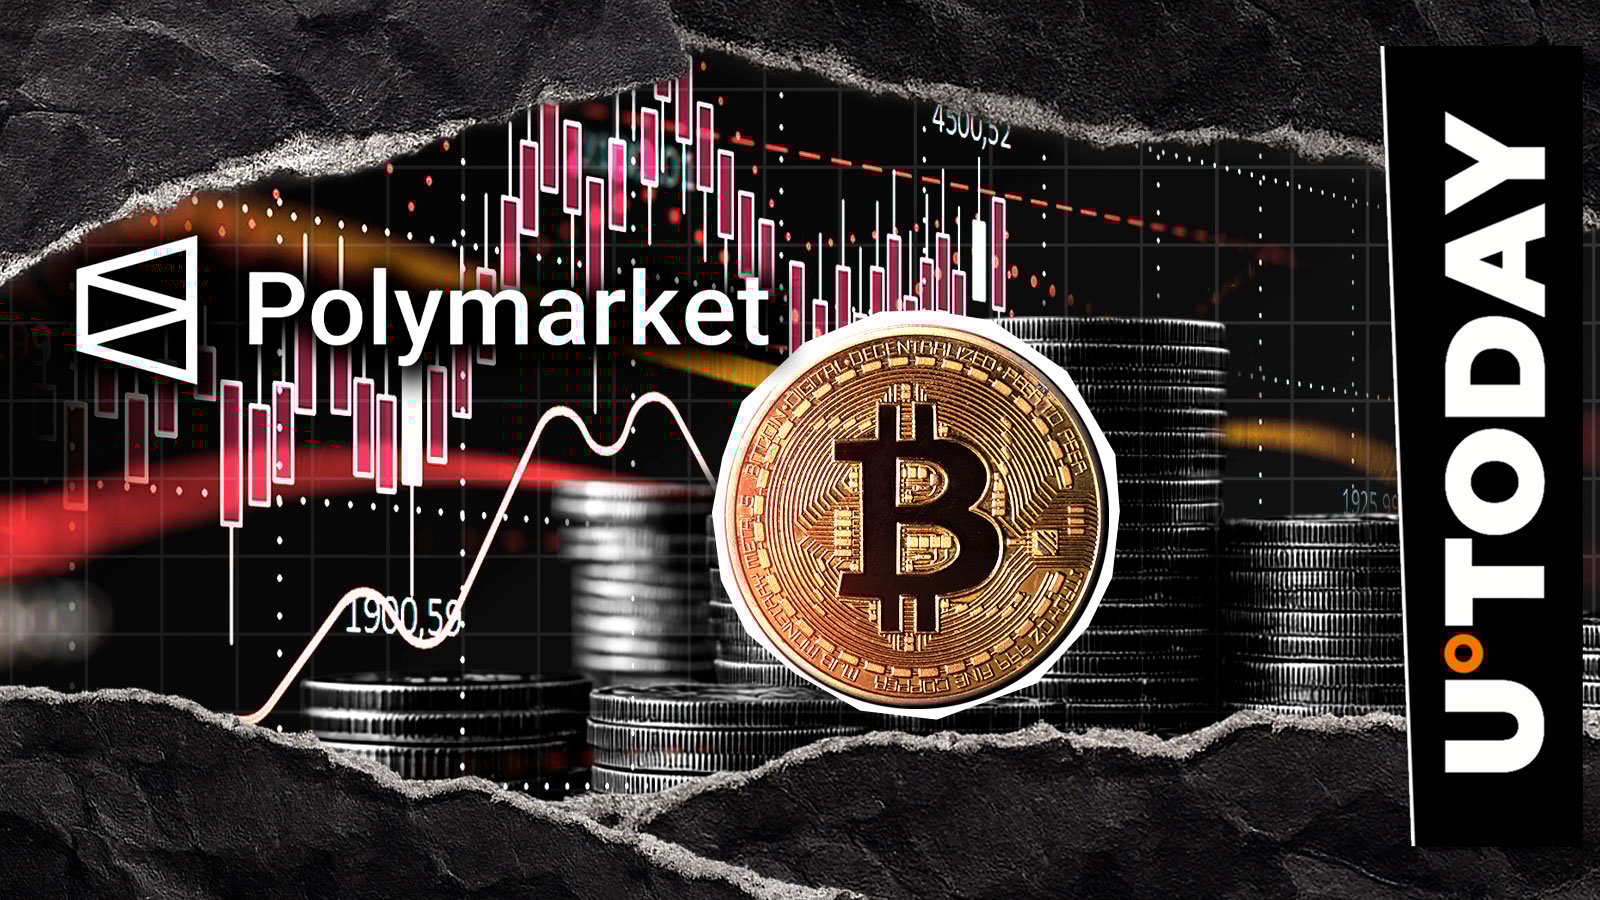
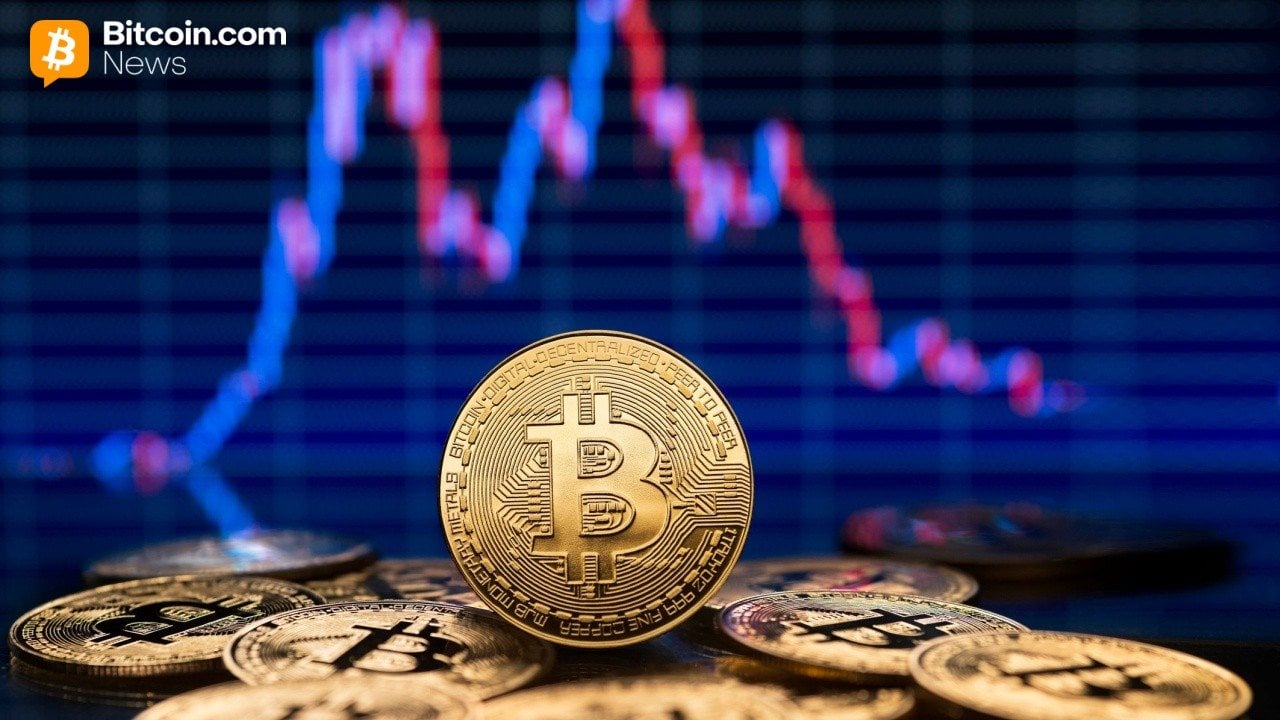
Bitcoin Miners Flood Binance With 51K BTC — Is A Sell-Off Imminent?
According to on-chain trackers, bitcoin miners have moved a huge amount of coins to a major exchange in recent days, signaling a clear change in behavior that the market will watch closely. Related Reading: Michael Saylor Issues Rally Cry To Bitcoin Army: “Starve The Bears!” Reports have disclosed miner transfers totaling 51,000 BTC — worth over $5.7 billion — to Binance since October 9. That is a very large flow of supply into a place where coins can be sold quickly. Miners Move Large Amounts To Exchanges On October 11, there was a dramatic spike when miners deposited more than 14,000 BTC to Binance, a day after the market plunged and bitcoin briefly fell to $104,000, an event that wiped out nearly $20 billion in leveraged positions. Based on data, the outflow on that day was the biggest miner transfer since last July. Market participants often read such moves as a tilt from holding toward selling, and that shift can change short-term sentiment fast. Binance Data Indicates That Since October 9, Miners Have Deposited a Total of 51K Bitcoin “The deposit of 51,000 Bitcoins within seven days represents a clear shift in miner behavior from holding to selling or liquidating.” – By @ArabxChain pic.twitter.com/qSN6WGK5bu — CryptoQuant.com (@cryptoquant_com) October 16, 2025 CryptoQuant and other analytics firms caution that moving coins to an exchange does not always equal an immediate sale. Some miners may be posting bitcoin as collateral for futures, funding operational needs, or shifting reserves between wallets for bookkeeping. Still, the market tends to react quickly to visible supply flows. Traders may act on that visible movement even if the coins are not sold right away, increasing price pressure through trading behavior alone. Whales And Funds Buying The Dip Reports have shown that large buyers have been active at the same time. One new wallet reportedly purchased $110 million worth of BTC from Binance, while another fresh address bought 465 BTC (about $51 million) from FalconX. In addition, US spot Bitcoin ETFs have recorded inflows. Those buyers could soak up some of the miner-supplied coins and limit how far the price falls. Market Momentum Remains Fragile After a wild week that erased large amounts of market value, bitcoin has struggled to regain clear momentum. Based on Bloomberg data, the coin was trading near $109,000 on Oct. 17 in Singapore. Bitcoin had hit an all-time high of $126,250 on October 6, so the pullback has been sharp and fast. For the week to Oct. 12, bitcoin slid as much as 6.5%, the largest weekly fall since early March. Related Reading: Biggest Shiba Inu Burn In Months — And It Came From A Coinbase Account Analysts put a key support near $107,000. A firm break below that level could invite deeper losses, they warn. On the flip side, steady buying by large holders and continued ETF demand might keep the market from sliding much further. The tug of war is plain: miners adding potential supply versus big buyers taking the other side. Featured image from Unsplash, chart from TradingView CoinOtag

CRYPTOCURRENCY
-

Ripple to Raise Over $1 Billion to Purchase XRP
58 dakika önce