2 days ago
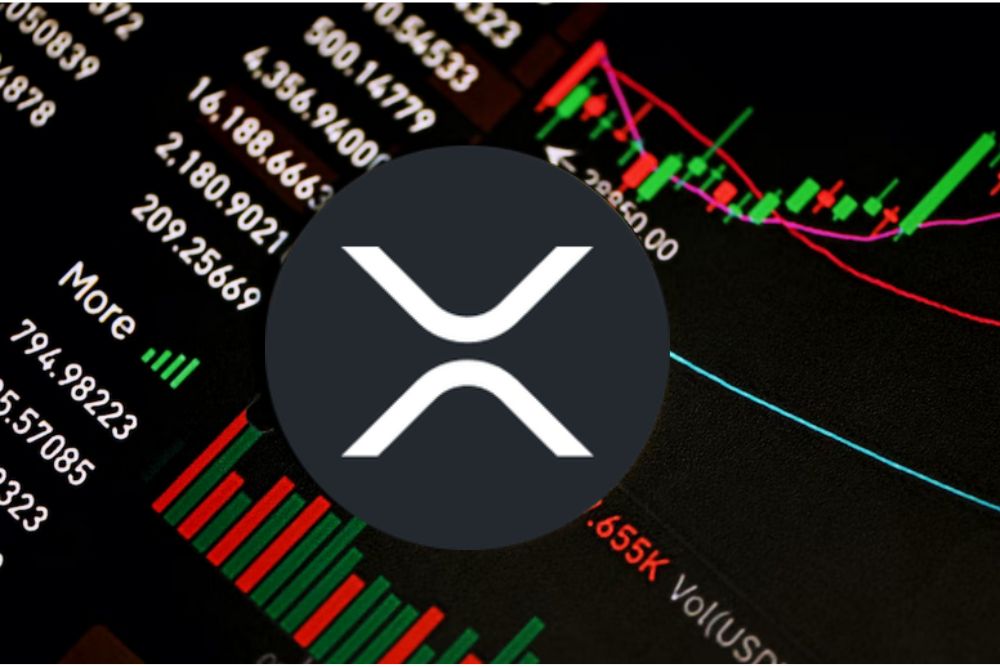
XRP price started a fresh increase above $2.50. The price is now showing positive signs and could aim for more gains above the $2.620 level. XRP price is attempting a recovery wave above the $2.50 zone. The price is now trading above $2.50 and the 100-hourly Simple Moving Average. There is a key bearish trend line forming with resistance at $2.60 on the hourly chart of the XRP/USD pair (data source from Kraken). The pair could start a fresh surge if it clears the $2.60 resistance. XRP Price Set To Surge? XRP price found support and started a strong recovery wave above $2.220, like Bitcoin and Ethereum . The price was able to climb above the $2.320 and $2.40 levels to enter a positive zone. The bulls were able to push the price above the 61.8% Fib retracement level of the downward move from the $3.05 swing high to the $1.40 swing low. However, the bears are still active near the $2.60 and $2.620 levels. Besides, there is a key bearish trend line forming with resistance at $2.60 on the hourly chart of the XRP/USD pair. The price is now trading above $2.50 and the 100-hourly Simple Moving Average. If there is a fresh upward move, the price might face resistance near the $2.550 level. The first major resistance is near the $2.60 level and the trend line. The main hurdle could be near the 76.4% Fib retracement level of the downward move from the $3.05 swing high to the $1.40 swing low at $2.660. A clear move above the $2.660 resistance might send the price toward the $2.720 resistance. Any more gains might send the price toward the $2.750 resistance. The next major hurdle for the bulls might be near $2.80. Another Drop? If XRP fails to clear the $2.60 resistance zone, it could start a fresh decline. Initial support on the downside is near the $2.50 level. The next major support is near the $2.420 level. If there is a downside break and a close below the $2.420 level, the price might continue to decline toward $2.320. The next major support sits near the $2.250 zone, below which the price could continue lower toward $2.20. Technical Indicators Hourly MACD – The MACD for XRP/USD is now gaining pace in the bullish zone. Hourly RSI (Relative Strength Index) – The RSI for XRP/USD is now above the 50 level. Major Support Levels – $2.50 and $2.420. Major Resistance Levels – $2.60 and $2.660.
NewsBTC
You can visit the page to read the article.
Source: NewsBTC
Tags :
XRP Ripple XRPBTC XRPUSD xrpusdt
Disclaimer: The opinion expressed here is not investment advice – it is provided for informational purposes only. It does not necessarily reflect the opinion of BitMaden. Every investment and all trading involves risk, so you should always perform your own research prior to making decisions. We do not recommend investing money you cannot afford to lose.
Japan’s Three Banking Heavyweights To Jointly Issue Stablecoins For Speedier Corporate Payments
Three of Japan’s top megabanks are reportedly developing a joint stablecoin protocol designed for businesses as institutional interest in blockchain-based digital money increases. NewsBTC

CryptoAppsy Empowers Your Crypto Journey with Unmatched Features!
CryptoAppsy offers real-time cryptocurrency data in multiple languages. Users benefit from smart alerts, multi-currency support, and curated news. Continue Reading: CryptoAppsy Empowers Your Crypto Journey with Unmatched Features! The post CryptoAppsy Empowers Your Crypto Journey with Unmatched Features! appeared first on COINTURK NEWS . NewsBTC
See Also
CRYPTOCURRENCY
-

Ripple to Raise Over $1 Billion to Purchase XRP
58 dakika önce